. 2008 Oct;36(18):5955-69.
doi: 10.1093/nar/gkn601. Epub 2008 Sep 23.

S-box and T-box riboswitches and antisense RNA control a sulfur metabolic operon of Clostridium acetobutylicum

Affiliations

S-box and T-box riboswitches and antisense RNA control a sulfur metabolic operon of Clostridium acetobutylicum

Gaëlle André et al. Nucleic Acids Res. 2008 Oct.

Abstract

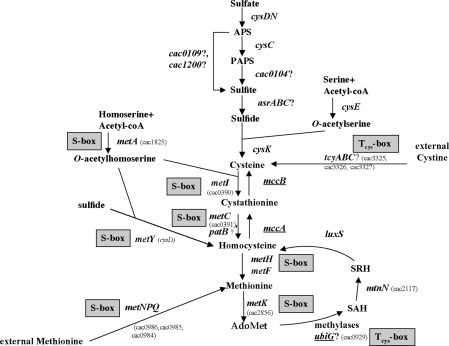
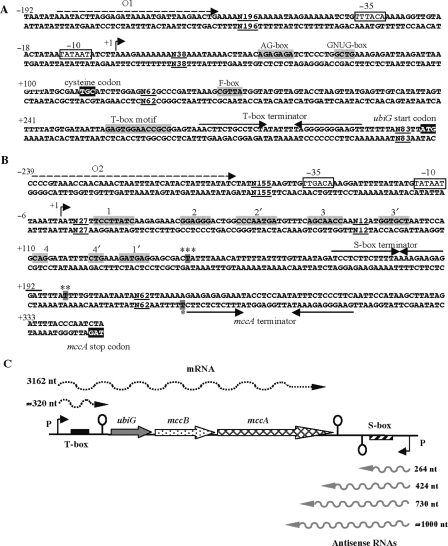
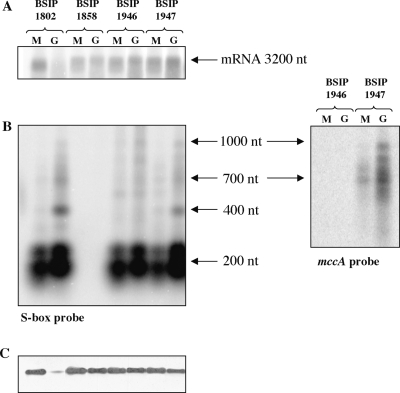
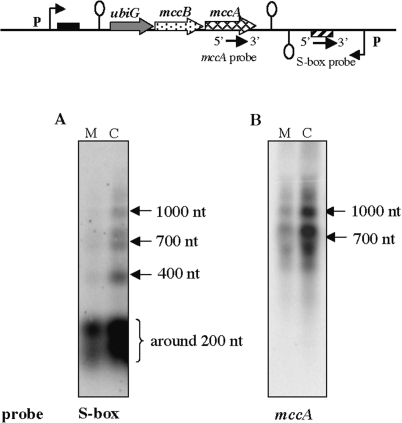
The ubiGmccBA operon of Clostridium acetobutylicum is involved in methionine to cysteine conversion. We showed that its expression is controlled by a complex regulatory system combining several RNA-based mechanisms. Two functional convergent promoters associated with transcriptional antitermination systems, a cysteine-specific T-box and an S-box riboswitch, are located upstream of and downstream from the ubiG operon, respectively. Several antisense RNAs were synthesized from the downstream S-box-dependent promoter, resulting in modulation of the level of ubiG transcript and of MccB activity. In contrast, the upstream T-box system did not appear to play a major role in regulation, leaving antisense transcription as the major regulatory mechanism for the ubiG operon. The abundance of sense and antisense transcripts was inversely correlated with the sulfur source availability. Deletion of the downstream promoter region completely abolished the sulfur-dependent control of the ubiG operon, and the expression of antisense transcripts in trans did not restore the regulation of the operon. Our data revealed important insights into the molecular mechanism of cis-antisense-mediated regulation, a control system only rarely observed in prokaryotes. We proposed a regulatory model in which the antisense RNA controlled the expression of the ubiG operon in cis via transcriptional interference at the ubiG locus.


Figures

Figure 1.
Figure 1.
Sulfur metabolism in C. acetobutylicum. The genes controlled by antisense RNAs are underlined. ‘S-box’ indicates the genes controlled by an S-box riboswitch. And ‘Tcys-box’ indicates the genes controlled by a cysteine-specific T-box system. A question mark indicates the genes probably involved in this pathway. AdoMet, S-adenosyl-methionine; Serine O-acetyltransferase, cysE; OAS-thiol-lyase, cysK; methionine adenosyltransferase, metK; adenosylhomocysteine nucleosidase, mtnN; S-ribosylhomocysteine lyase, luxS; cystathionine β-synthase, mccA; cystathionine γ-lyase, mccB; homoserine acetyl-transferase, metA; cystathionine γ-synthase, metI; cystathionine β-lyase, metC and patB; methionine synthase, metH; ATP sulfurylase, cysDN; APS kinase, cysC; anaerobic sulfite reductase, asrABC (11,12). The cac numbers for C. acetobutylicum genes correspond to those of AcetoList (http://bioinfo.hku.hk/GenoList/index.pl?database=acetolist) (38).
Figure 2.
Figure 2.
The T-box and the S-box regulatory region of the ubiG operon of C. acetobutylicum. (A) T-box regulatory region. (B) S-box regulatory region. The transcriptional start sites ‘+1’ for sense and antisense transcripts are identified by 5′RACE and are indicated by broken arrows. The −10 and −35 regions are boxed. The transcriptional terminators are indicated by arrows. The numbers indicate positions relative to the transcriptional start sites. The regions indicated in gray correspond to the conserved motives of the S-box (1, 1′, 2, 2′, 3, 3′, 4, 4′) and the T-box (T-box motif, AG, GNUG, F-boxes). Oligonucleotides (O1) and (O2), which are indicated by dashed arrows, are used for amplification of the entire ubiG operon region with regulatory sequences. The ubiG start codon, the mccA stop codon and the cysteine-specific codon (TGC) of the T-box system are indicated in black. The 3′-end of the ubiGmccBA transcript indicated by a star was identified by 3′RACE. The 3′-end of the short transcript terminated in the S-box region is indicated by two stars when identified by 3′RACE with RNA extracted from a ▵rnjBpspac-rnjA mutant (BSIP1899) and by three stars when identified by 3′RACE with RNA extracted from the wild-type or a rnc mutant (BSIP1900). (C) Scheme of the ubiG region showing different detected sense (above) and antisense (below) transcripts. The antisense RNAs are indicated by gray arrows, and the mRNA is indicated by black dashed arrows. Their estimated lengths are indicated at right. Broken arrows with ‘P’ symbol indicate the position of the upstream and downstream promoters; loops indicate putative transcriptional terminators for the S-box, T-box and for the 3′-end of the ubiG operon.
Figure 3.
Figure 3.
Modulation of MccB synthesis in response to sulfur availability. The homocysteine γ-lyase activity of MccB is detected on zymogram. A total of 40 μg of crude extracts were charged on a native polyacrylamide gel (12%). The release of sulfide from homocysteine due to homocysteine γ-lyase activity was directly detected by the precipitation of insoluble PbS (see Materials and methods section). The proteins were extracted from B. subtilis strains BSIP1802 (P-Tbox-ubiGmccBA-Sbox-P) (A), BSIP1858 (P-Tbox-ubiGmccBA) (B) or C. acetobutylicum ATCC824 strain (C); strains were grown in the presence of 5 mM glutathione (G), 1 mM methionine (M), 1 mM K2SO4 (S) or 1 mM cystine or cysteine (C). These results are representative of at least two independent experiments.
Figure 4.
Figure 4.
Northern blot analysis of sense and antisense RNAs. The RNAs were extracted from the strains BSIP1802 (P-Tbox-ubiGmccBA-Sbox-P) (AC) or BSIP1858 (P-Tbox-ubiGmccBA) (D and E) grown with 1 mM methionine (M) or 5 mM glutathione (G). The hybridizations were performed with single strand RNA probes. The positions of the probes are indicated by arrows on the corresponding genomic region scheme. Broken arrows with ‘P’ symbol indicate the position of the upstream and downstream promoters; loops indicate putative transcriptional terminators for the S-box, T-box and for the 3′-end of the ubiG operon. (A and D) The ubiG probe; (B and E) mccA probe; (C) S-box probe. The main transcripts observed and their sizes are indicated by arrows at the right of the northern blot figure. Longer exposure time was required for better detection of the 400, 700 and 1000 nt transcripts. The RNA size is determined with single strand RNA size markers ‘RNA millennium’ and ‘RNA century-Plus’ (Ambion). These results are representative of at least three independent experiments.
Figure 5.
Figure 5.
Effect of the expression of the antisense RNA in trans on the ubiGmccBA regulation. Northern blot analysis was carried out on total RNA extracted from BSIP1802 (P-Tbox-ubiGmccBA-Sbox-P), BSIP1858 (P-Tbox-ubiGmccBA), BSIP1946 [P-Tbox-ubiGmccBA lacA::erm Sbox(−227, + 232)] or BSIP1947 [P-Tbox-ubiGmccBA lacA::erm AS(−227, + 1137)], after growth with 1 mM methionine (M) or 5 mM glutathione (G). (A) The mRNA expression was detected with the probe hybridizing with the ubiG gene. (B) The antisense RNAs were detected with the probe complementary to the S-box region. On the right of this figure, detection with a mccA probe is also shown for BSIP1946 and BSIP1947. The arrows show the different antisense RNAs detected with their estimated size. (C) The MccB homocysteine γ-lyase activity was detected on zymogram. These results are representative of at least two independent experiments.
Figure 6.
Figure 6.
Expression of the antisense RNAs in C. acetobutylicum. Northern blot analysis was carried out on total RNA extracted from strain ATCC824 after growth with 1 mM methionine (M) or 1 mM cysteine (C). The antisense RNAs were detected with the probe hybridizing with the S-box motif (A) or the mccA gene (B). The positions of the probes are indicated by arrows on the corresponding genomic region scheme. Broken arrows with ‘P’ symbol indicate the position of the upstream and downstream promoters; loops indicate putative transcriptional terminators. The arrows show the different antisense RNAs detected with their estimated size. The RNA size is determined with single strand RNA size markers ‘RNA millennium’ (Ambion). These results are representative of at least two independent experiments.

References

    1. Guédon E, Martin-Verstraete I. In: Amino Acid Biosynthesis-pathways, Regulation and Metabolic Engineering. Wendisch VF, editor. Germany: Springer; 2007. pp. 195–218.
    1. Schelle MW, Bertozzi CR. Sulfate metabolism in mycobacteria. Chembiochem. 2006;7:1516–1524. - PubMed
    1. Sekowska A, Kung HF, Danchin A. Sulfur metabolism in Escherichia coli and related bacteria: facts and fiction. J. Mol. Microbiol. Biotechnol. 2000;2:145–177. - PubMed
    1. Greene RC. In: Escherichia coli and Salmonella, Cellular and Molecular Biology. Neidhardt FC, editor. Washington, DC: ASM Press; 1996. pp. 542–560.
    1. Ludwig ML, Matthews RG. Structure-based perspectives on B12-dependent enzymes. Annu. Rev. Biochem. 1997;66:269–313. - PubMed

Publication types

MeSH terms