. 2008 Oct 1;100(19):1401-11.
doi: 10.1093/jnci/djn304. Epub 2008 Sep 23.

Quantitation of Aurora kinase A gene copy number in urine sediments and bladder cancer detection

Affiliations

Quantitation of Aurora kinase A gene copy number in urine sediments and bladder cancer detection

Hong-Seok Park et al. J Natl Cancer Inst. .

Erratum in

  • J Natl Cancer Inst. 2008 Dec 3;100(23):1740

Abstract

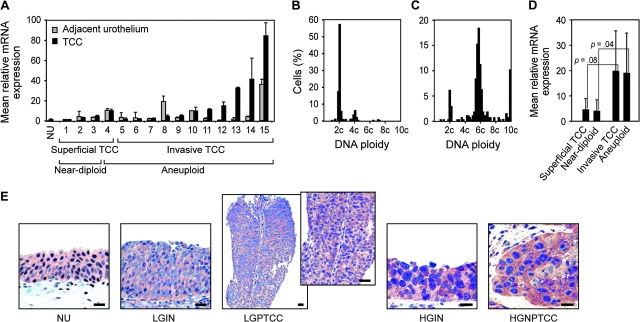
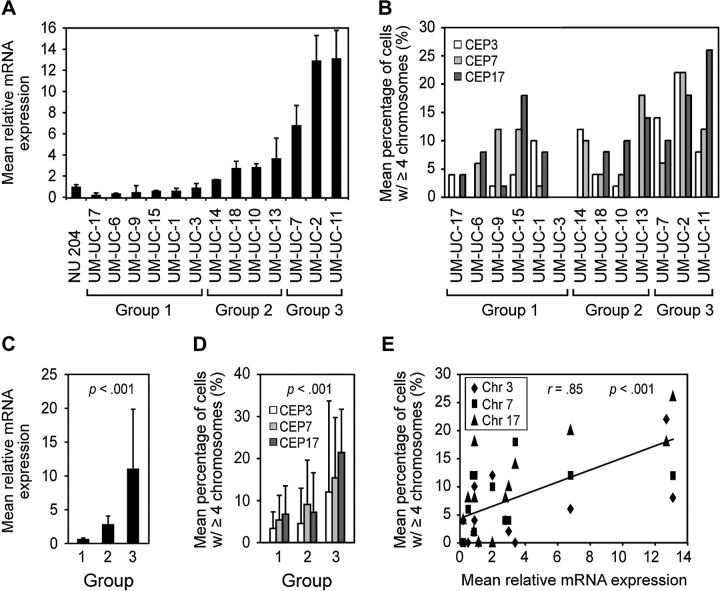
Background: Chromosome missegregation and the resulting aneuploidy is a common change in neoplasia. The Aurora kinase A (AURKA) gene, which encodes a key regulator of mitosis, is frequently amplified and/or overexpressed in cancer cells, and the level of AURKA amplification is associated with the level of aneuploidy. We examined whether AURKA gene amplification is a biomarker for the detection of bladder cancer.

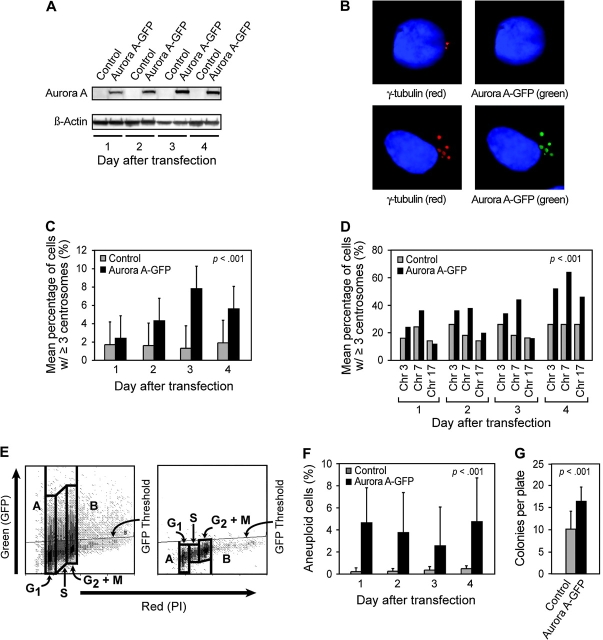
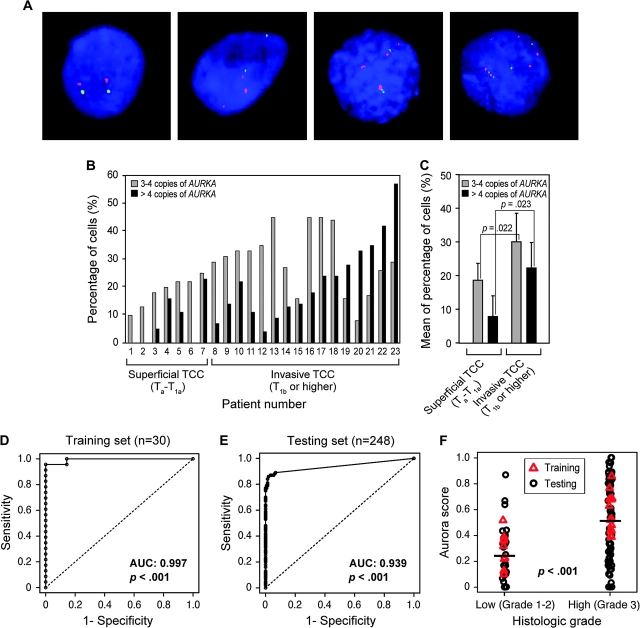
Methods: The effect of ectopic expression of Aurora kinase A (AURKA) using an adenoviral vector in simian virus 40-immortalized urothelial cells (SV-HUC) on centrosome multiplication and chromosome copy number was measured in vitro by immunofluorescence and fluorescence in situ hybridization (FISH), respectively. The FISH test was also used to examine AURKA gene copy number in exfoliated cells in voided urine samples from 23 patients with bladder cancer and 7 healthy control subjects (training set), generating a model for bladder cancer detection that was subsequently validated in an independent set of voided urine samples from 100 bladder cancer patients and 148 control subjects (92 healthy individuals and 56 patients with benign urologic disorders). An AURKA gene score (the proportion of cells with three or more AURKA signals) was used to produce receiver operating characteristic (ROC) curves and to calculate the specificity and sensitivity of the AURKA FISH test. Differences between mean AURKA scores in different pathogenetic groups of bladder cancer stratified according to histological grade and stage were tested by unpaired Mann-Whitney t tests or one-way Wilcoxon tests. All statistical tests were two-sided.

Results: Forced overexpression of AURKA in urothelial cells induced amplification of centrosomes, chromosome missegregation, and aneuploidy, and natural overexpression was detectable in in situ lesions from patients with bladder cancer. The FISH test for the AURKA gene copy number performed on the validation set yielded a specificity of 96.6% (95% confidence interval [CI] = 92.3% to 98.5%) and sensitivity of 87% (95% CI = 79.0% to 92.2%) and an area under the ROC curve of 0.939 (95% CI = 0.906 to 0.971; P < .001).

Conclusion: Overexpression of AURKA can cause aneuploidy in urothelial cells, and the AURKA gene copy number is a promising biomarker for detection of bladder cancer.


Figures

Figure 1
Figure 1
Expression of AURKA mRNA in transitional cell carcinoma (TCC) and its relation to DNA ploidy. A) Relative level of AURKA mRNA in paired samples of adjacent urothelium and TCC measured by quantitative reverse transcription–polymerase chain reaction. Urothelial cell suspensions (NU) prepared from ureters from nephrectomy specimens free of urothelial neoplasia were used as standards from which the relative expressions of AURKA mRNA were calculated. The mean mRNA levels from three separate urothelial cell suspensions were determined. Error bars correspond to 95% confidence intervals. B) DNA histogram of near-diploid TCC. C) DNA histogram of aneuploid TCC. D) Mean relative AURKA mRNA levels in 4 low-grade (grades 1–2) superficial (Ta–T1a), 11 high-grade (grade 3) invasive (T1b or higher), 3 near-diploid, and 12 aneuploid TCCs. Wilcoxon rank sum tests were used to compare the relative mRNA expression levels in superficial (Ta–T1a) vs invasive (T1b or higher) and in near-diploid vs aneuploid TCCs. E) Representative immunohistochemical staining of AURKA in human bladder cancers and adjacent in situ lesions: (first panel) normal urothelium (NU), (second panel) low-grade intraurothelial neoplasia (LGIN), (third panel) low-grade superficial papillary TCC (LGPTCC) (inset, higher magnification showing a fragment of papillary structures of LGPTCCs), (fourth panel) carincoma in situ (also referred to high-grade intraurothelial neoplasia [HGIN]), (fifth panel) high-grade invasive nonpapillary TCC (HGNPTCC). Scale bars = 50 μm. The cytoplasmic expression of AURKA protein was visualized with amino-ethyl carbazole, and the nuclei were counterstained with hematoxylin.
Figure 2
Figure 2
Aurora kinase A (AURKA) mRNA expression and chromosomal copy number in human bladder cancer cell lines. A) Expression of AURKA mRNA in 11 human bladder cancer cell lines as determined by quantitative reverse transcription–polymerase chain reaction relative to that in cultured human urothelial cells (NU204). The mean level of expression from three separate harvests of NU204 cells at passage 6 was used as the referent. The bladder cancer cell lines were divided into three groups based on their levels of AURKA mRNA expression as follows: group 1, no elevation of AURKA mRNA expression; group 2, mild elevation of AURKA mRNA expression (up to fourfold); and group 3, strong elevation of AURKA mRNA expression (more than fourfold). Error bars correspond to 95% confidence intervals (CIs) from three independent samples for each cell line. B) Chromosomal copy number revealed by quantitative FISH using centromeric probes to chromosomes 3, 7, and 17 (CEP3, CEP7, and CEP17, respectively). The graph shows the percentage of cells with four or more copies of each chromosome in the three groups of bladder cancer cell lines stratified according to their relative levels of AURKA mRNA expression as shown in A. C) Mean AURKA mRNA level in the three groups of bladder cancer cell lines. P value is from analysis of variance (ANOVA) comparing the three sets of values. D) Mean percentage of cells with four or more copies of chromosomes 3, 7, or 17 revealed by FISH in the three groups of bladder cancer cell lines as shown in A. Error bars correspond to 95% CIs. To compare chromosome copy number changes, overall percentages averaged across chromosomes were analyzed by ANOVA. E) Scatterplot analysis of the mean relative AURKA mRNA levels by the mean proportion of cells with four or more copies of chromosomes 3, 7, or 17. The diagonal regression line shows a predicted average mean percentage of cells with at least four chromosomes. Correlation was assessed by averaging percentages across chromosomes as described above (Pearson correlation coefficient r = 0.85, 95% CI = 0.56 to 0.95).
Figure 3
Figure 3
Ectopic expression of AURKA–green fluorescent protein (GFP) fusion protein in SV-HUC cells. A) Immunoblot analysis of AURKA–GFP fusion protein expression 1–4 days after transfection of SV-HUC cells with an adenoviral vector containing AURKA–GFP fusion insert (upper panels). Expression of β-actin is shown as a loading control (lower panels). Control samples were transfected with an empty adenoviral vector. B) Immunofluorescence analysis of ectopic expression of AURKA–GFP fusion protein (green) and γ-tubulin localization (red) with DAPI (blue) as a nuclear counterstain (lower panels) in a cell infected with an adenoviral vector lacking the AURKA insert (top panels) and a cell infected with an adenoviral vector containing AURKA insert (bottom panels). The image of control cell obtained with a red filter (upper left) reveals two centrosomes. The image of the same cell obtained with a green filter (upper right) reveals no ectopic expression of AURKA–GFP fusion protein in centrosomes. The image of a cell transfected with an adenoviral vector containing AURKA–GFP insert (bottom left) obtained with a red filter shows multiplication of centrosomes revealed with anti-γ-tubulin antibody. The image of the same cell obtained with a green filter shows ectopically expressed AURKA–GFP protein in multiplied centrosomes. C) Quantitative assessment of centrosomes and chromosomal copy number induced by ectopically expressed AURKA. The centrosomes were analyzed by fluorescent microscopy in 500 cells for each transfection, and cells containing three or more centrosomes were recorded. All tests were performed in triplicate. Error bars correspond to 95% confidence intervals (CIs). The effect of AURKA overexpression was assessed using analysis of variance (ANOVA) to compare percentages of cells with abnormal centrosome numbers (ie, three or more). The ANOVA included the following three factors: 1) transfection with an adenoviral vector containing AURKA–GFP insert compared with control cells transfected with an empty adenoviral vector; 2) days after transfection, and 3) batch of the experiments. D) Chromosomal copy number revealed by quantitative FISH using centromeric probes to chromosomes 3, 7, and 17 (CEP3, CEP7, and CEP17, respectively). The percentage of cells with three or more copies of each chromosome was recorded 1–4 days after transfection with an adenoviral vector containing AURKA–GFP insert. The control cells were transfected with an empty adenoviral vector. Change in chromosome copy number was computed by summing percentages across chromosomes and performing ANOVA, which included factors such as transfection with an adenoviral vector containing AURKA–GFP insert vs control and days after transfection. E) Dual-fluorescence fluorescence-activated cell sorter analysis of ectopically expressed AURKA–GFP protein (green fluorescence) in relation to DNA content revealed with propidium iodide counterstain (red fluorescence). Dual-fluorescence scattergram 4 days after transfection of SV-HUC cells with an adenoviral vector containing AURKA–GFP insert (left). Control scattergram of SV-HUC cells 4 days after transfection with an empty adenoviral vector (right). Boxes A and B of the scattergram designate cells containing <2C and >4C aneuploid DNA content, respectively. Boxes G1, S, G2+M designate cell cycle compartments. Horizontal line designates a baseline control GFP threshold. F) Percentage of aneuploid cells in cell transfected with an adenoviral vector containing AURKA–GFP insert. The cells transfected with an empty adenoviral vector were used as a control. The cells with an aneuploid DNA content were computed as the percentage of GFP positive cells with a DNA index <2C and >4C as shown in E. Error bars correspond to 95% CIs. All measurements were made in triplicate. The increase in aneuploid cells was assessed using ANOVA with factors such as transfection with AURKA–GFP insert vs control and days after transfection. G) Colony formation on soft agar. Cells were plated on soft agar 1 day after transfection with an adenoviral vector containing AURKA–GFP insert, and colonies were counted 2 weeks after plating the cells on the agar. Cells transfected with an empty adenoviral vector were used as a control. Mean number of colonies per plate from three independent experiments, each with three replicates, was plotted. Error bars correspond to 95% CIs. The increase in colony formation was assessed using ANOVA with factors such as transfections with adenoviral vector containing AURKA–GFP inserts vs control and plating batch. Ad/Control: cells infected with an adenoviral vector without AURKA insert, Ad/AURKA–GFP: cells transfected with adenoviral vector containing wild-type AURKA.
Figure 4
Figure 4
Detection of bladder cancer cells in voided urine by FISH with a probe specific for AURKA. A) Dual-fluorescence FISH with probes for AURKA (red) and the chromosome 20 α-satellite DNA (green). Nuclei were counterstained with DAPI (blue); (first panel) normal urothelial cell; (second panel) a low-grade (grades 1–2) transitional cell carcinoma (TCC) cell; (third panel) a high-grade (grade 3) invasive TCC cell; (fourth panel) a high-grade (grade 3) invasive TCC cell. B) Quantitative FISH analysis of AURKA gene copy number in voided urine specimens from 23 patients with TCC of the bladder whose urine samples were included in the training set. The percentage of cells with low (3–4 copies) and high (>4 copies) amplification of AURKA in the individual patients is shown. C) Mean percentage of cells with 3–4 copies of AURKA and >4 copies of AURKA in low-grade (grades 1–2) superficial (Ta–T1a) and high-grade (grade 3) invasive (T1b or higher) TCCs. Two-sided P value for a two-sample t test comparing the mean percentage of cells with 3–4 copies of AURKA and 4 copies of AURKA in low-grade (grades 1–2) superficial (Ta–T1a) and high-grade (grade 3) invasive (T1b or higher) TCCs is shown. D) Receiver operating characteristic (ROC) curve for AURKA FISH test in the training set, which consisted of 23 urine samples from patients with bladder cancer and 7 urine samples from healthy unaffected control subjects (n = 30). The AURKA FISH test for the detection of bladder cancer showed an area under the receiver operating characteristic curve (AUC) of 0.997 (95% confidence interval [CI] = 0.984 to 1.000). P value was calculated from two-sided Wilcoxon–Mann–Whitney rank sum test statistics. E) ROC curve for AURKA FISH test in the test set, which consisted of 100 urine samples from patients with bladder cancer and 148 urine samples from healthy unaffected control subjects (n = 92) and patients with benign urological disorders (n = 56). The AURKA FISH test showed an AUC of 0.939 (95% CI = 0.906 to 0.971). P < .001 (two-sided Wilcoxon–Mann–Whitney rank sum test statistics). F) AURKA gene score for the training and testing sets by histological grade of TCC stratified into low (grades 1–2) and high (grade 3) groups. Horizontal bars designate the mean AURKA gene score for TCCs of low and high histological grade. P value was calculated from two-sided Mann–Whitney t test.

References

    1. Perkins AS, Stern DF. Molecular Biology of Cancer. 5th ed. Philadelphia, PA: Lippincott-Raven Publishers; 1997.
    1. Heim S, Mitelman F. Cancer Cytogenetics. 2nd ed. New York: Wiley-Liss; 1995.
    1. Sen S. Aneuploidy and cancer. Curr Opin Oncol. 2000;12(1):82–88. - PubMed
    1. Zhou H, Kuang J, Zhong L, et al. Tumour amplified kinase STK15/BTAK induces centrosome amplification, aneuploidy and transformation. Nat Genet. 1998;20(2):189–193. - PubMed
    1. Katayama H, Zhou H, Li Q, Tatsuka M, Sen S. Interaction and feedback regulation between STK15/BTAK/Aurora-A kinase and protein phosphatase 1 through mitotic cell division cycle. J Biol Chem. 2001;276(49):46219–46224. - PubMed

Publication types

MeSH terms