. 2008 Dec;68(14):1549-64.
doi: 10.1002/dneu.20679.

Functional differentiation of a clone resembling embryonic cortical interneuron progenitors

Affiliations

Functional differentiation of a clone resembling embryonic cortical interneuron progenitors

Hedong Li et al. Dev Neurobiol. 2008 Dec.

Abstract

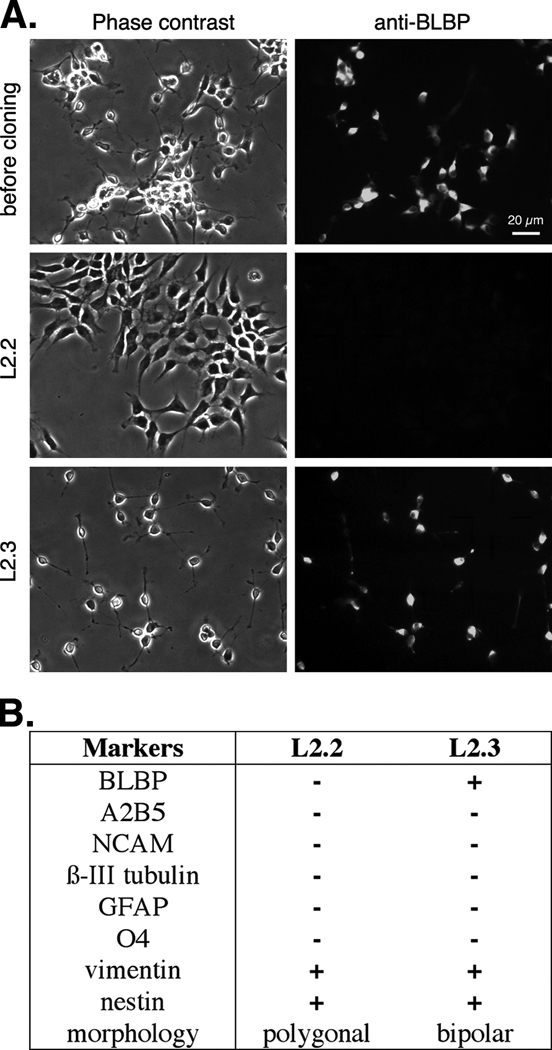
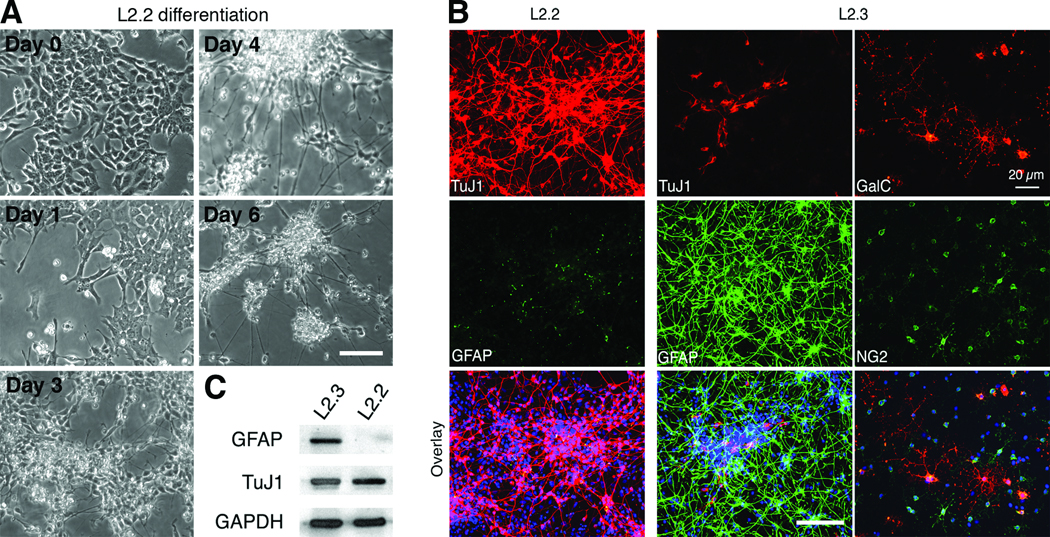
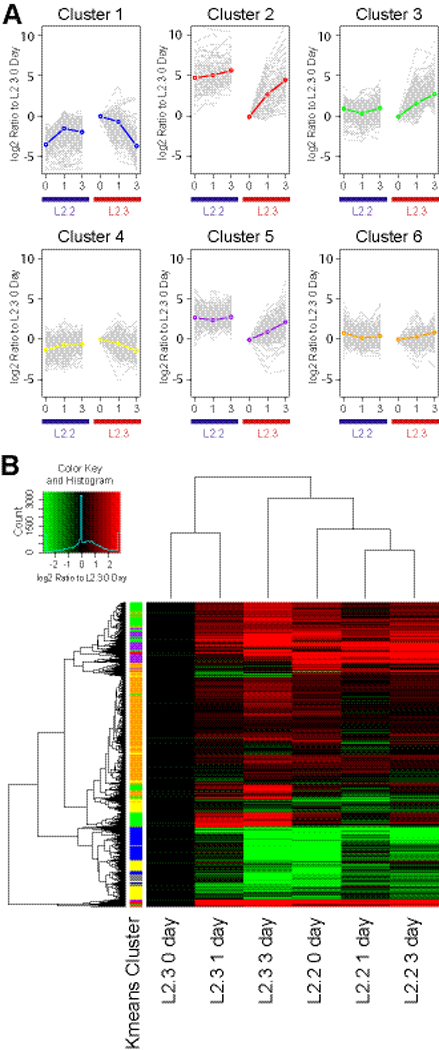
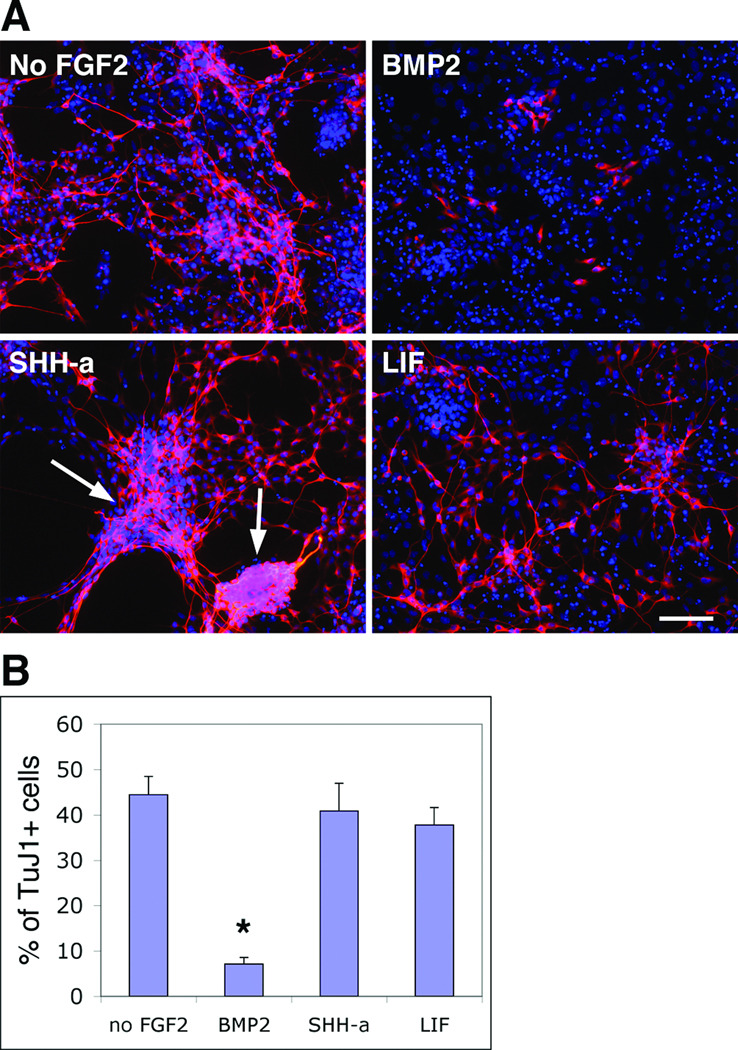
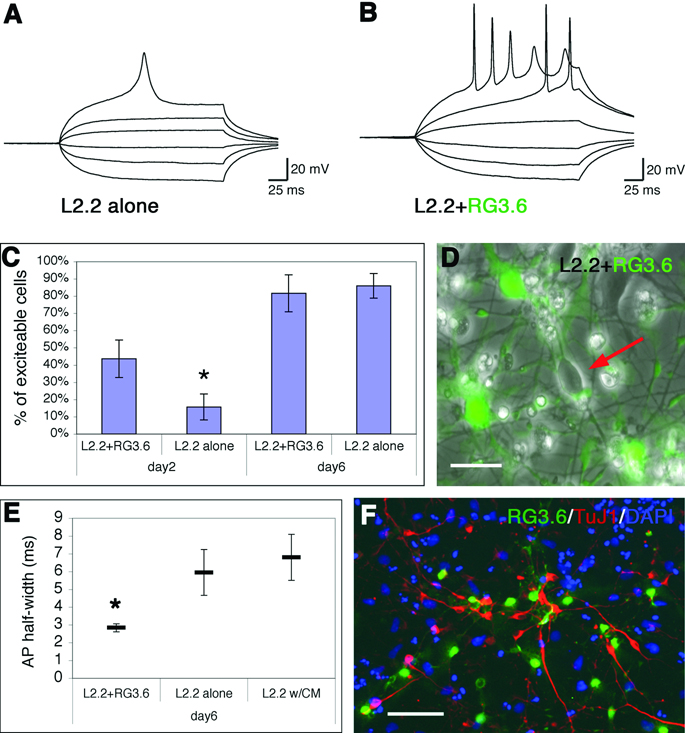
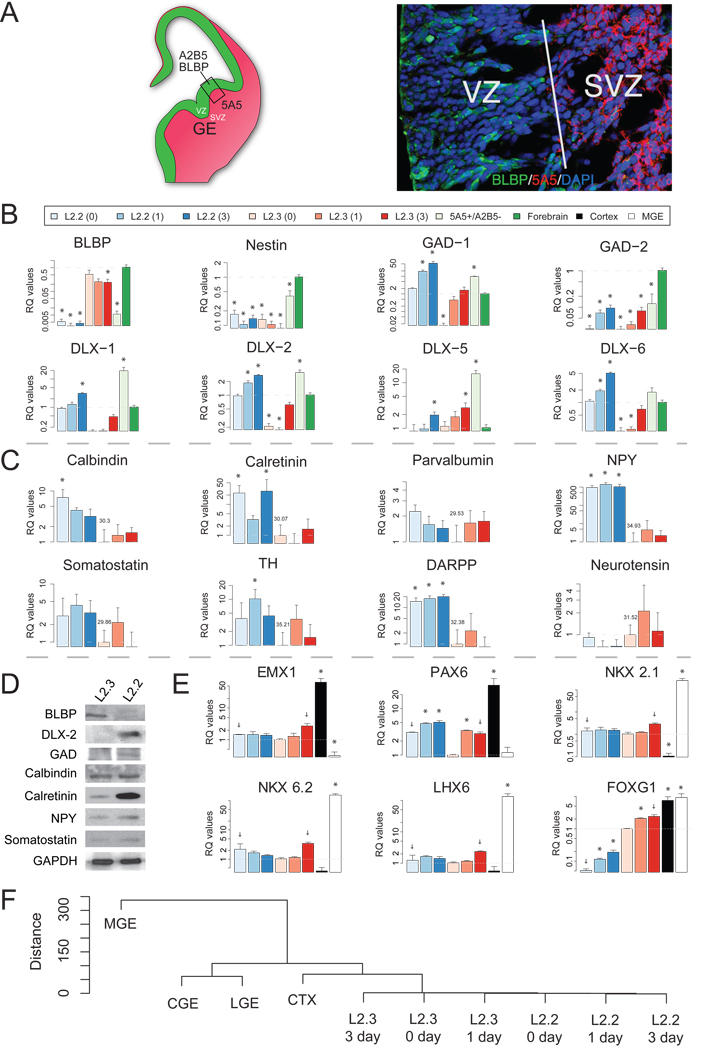
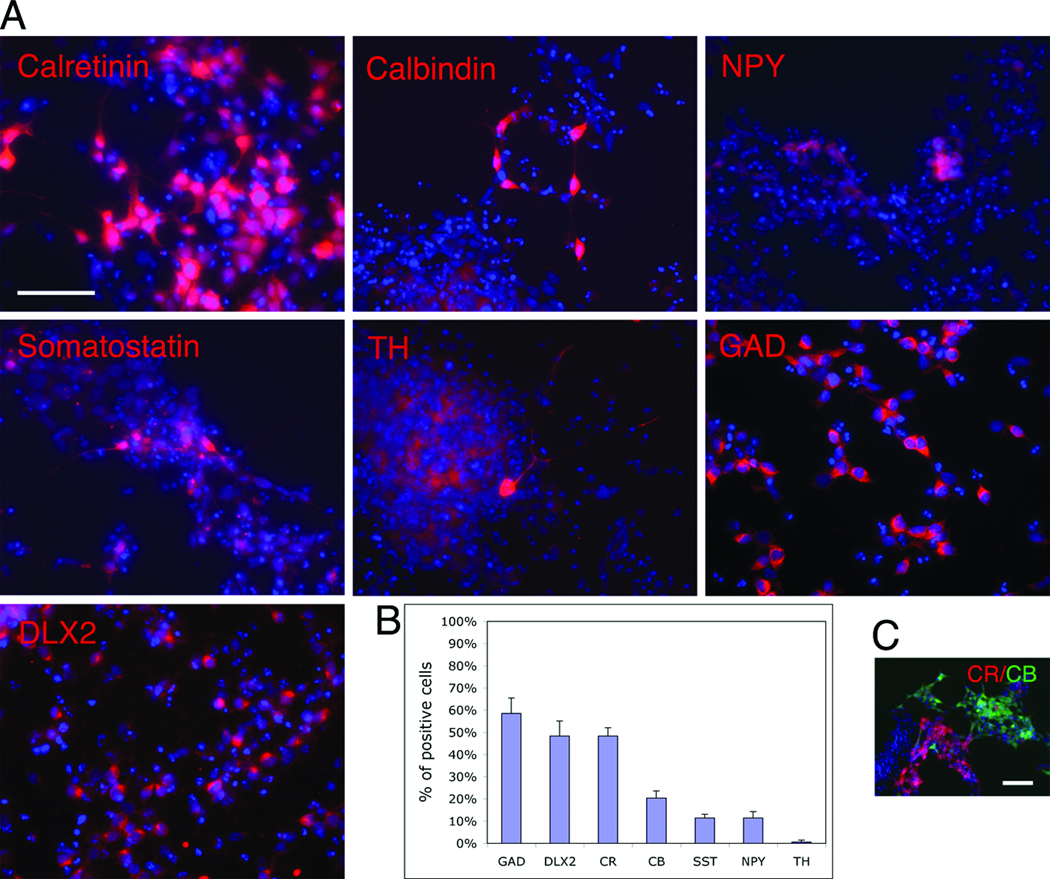
We have generated clones (L2.3 and RG3.6) of neural progenitors with radial glial properties from rat E14.5 cortex that differentiate into astrocytes, neurons, and oligodendrocytes. Here, we describe a different clone (L2.2) that gives rise exclusively to neurons, but not to glia. Neuronal differentiation of L2.2 cells was inhibited by bone morphogenic protein 2 (BMP2) and enhanced by Sonic Hedgehog (SHH) similar to cortical interneuron progenitors. Compared with L2.3, differentiating L2.2 cells expressed significantly higher levels of mRNAs for glutamate decarboxylases (GADs), DLX transcription factors, calretinin, calbindin, neuropeptide Y (NPY), and somatostatin. Increased levels of DLX-2, GADs, and calretinin proteins were confirmed upon differentiation. L2.2 cells differentiated into neurons that fired action potentials in vitro, and their electrophysiological differentiation was accelerated and more complete when cocultured with developing astroglial cells but not with conditioned medium from these cells. The combined results suggest that clone L2.2 resembles GABAergic interneuron progenitors in the developing forebrain.


Figures

Fig. 1
Fig. 1. Generation and characterization of the cortical neuronal progenitor clone L2.2
A. L2.2 and L2.3 exhibited distinct morphology on laminin substrates. L2.3 cells expressed the radial glial marker, BLBP, while L2.2 cells did not. B. Summary showing expression of cell type specific markers detected by immunofluorescence in the two clones without differentiation.
Fig. 2
Fig. 2. Restricted neuronal differentiation of L2.2 clone
L2.2 and L2.3 progenitor cells were maintained in FGF2 containing serum free medium. To initiate differentiation, FGF2 was withdrawn from the culture medium, and 0.5% of FBS was added to promote cell survival. A. Phase-contrast images showing morphological changes of L2.2 cells during differentiation after FGF2 withdrawal. B. L2.2 cells differentiated exclusively into TuJ1+ neurons, while L2.3 cells differentiate into both GFAP+ astrocytes and TuJ1+ neurons within 6 days. C. Western blot analysis confirmed the restricted neuronal differentiation of L2.2 cells with only β-III tubulin (TuJ1) expression and no detectable GFAP expression. Differentiated L2.3 cells expressed both markers. GAPDH was used to normalize the sample loading. Scale bars, 50 µm.
Fig. 3
Fig. 3. Differences in gene expression patterns in L2.2 and L2.3 cells and during differentiation
Upon FGF2 withdrawal, total RNA samples of L2.2 and L2.3 cultures were harvested after 0, 1 and 3 days and analyzed on rat genome survey chip (AB 1700). Significant genes were k-means clustered (k=6) to identify similar expression patterns (A), and were also shown as the hierarchically clustered heatmap plotted using R (B). For each k-means cluster, the calculated mean of all cluster members is plotted and individual genes are plotted in grey to show variability within the cluster. Assignment of a gene to a specific cluster is defined by an 80% membership in that cluster upon repeated fittings. Detailed gene expression profiles and cluster memberships are in Supplemental Table 1.
Fig. 4
Fig. 4. BMP2 suppressed L2.2 neuronal differentiation
A. L2.2 cells were allowed to differentiate after FGF2 withdrawal and in the presence of the indicated factors for 3 days. Immunostaining with neuron specific antibody, TuJ1 (red), showed that BMP2 (25 ng/ml) in comparison with control (No FGF2) suppressed neuronal differentiation, while SHH-agonist (100 nM) and LIF (10 ng/ml) did not have significant effects. Enhanced fasciculation and aggregation of the neuronal processes were seen in SHH-a treated cultures (arrows). DAPI (blue) was used to label nuclei. B. Percentage of TuJ1 positive cells among total cells (DAPI+) were calculated for different treatments, and the values were shown as mean with standard errors from triplicate experiments (n = 604 for No FGF2; 465 for BMP2; 605 for SHH-a and 477 for LIF). The large neuronal aggregates or bundles where individual cells could not be distinguished were excluded from counting. *, p < 0.05 (Student t-test). Scale bar, 50 µm.
Fig. 5
Fig. 5. Co-culturing L2.2 cells with RG3.6 cells promoted development of AP
A. Example of current-clamp recording from an L2.2 cell 6 days after FGF2 withdrawal. Responses to six depolarizing current injections of increasing magnitude are shown, with the largest one evoking action potential firing. B. Example of current-clamp recording from a L2.2 cell co-cultured with RG3.6 cells 6 days after FGF2 withdrawal. Responses to six depolarizing current injections are shown, with the largest two evoking action potential firing. C. Whole cell current-clamp recordings made from L2.2 derived cells under four different conditions, L2.2 alone and L2.2+RG3.6 co-cultures at day 2 and day 6 after FGF2 withdrawal. The percentage of L2.2 cells that fired action potentials was significantly higher on day 2 for cells in co-cultures (n = 25) compared to being cultured alone (n = 23, p < 0.05); data show standard errors from 6 independent experiments. There was no difference in the percentage of excitable cells on day 6 (p > 0.95, n = 21 for both), however, nearly all recorded cells were excitable. D. An example of GFP and phase-contrast overlaid images showing L2.2 (GFP-negative, arrow) differentiation in co-culture with RG3.6 cells (GFP-positive). Only GFP-negative L2.2 cells were recorded. Scale bar, 10 µm. E. The half-width (in milliseconds) of AP in day 6 cultures of L2.2+RG3.6 (n=17), L2.2 alone (n=18) and L2.2 with RG3.6-conditioned medium (n=12). The average half-width was significantly lower in L2.2+RG3.6 co-cultures than in either L2.2 alone or L2.2 with RG3.6 condition medium, p <0.05. F. Six days after FGF2 withdrawal, immunostaining showed that TuJ1 positive (red) L2.2 cells were often seen in close proximity with GFP positive RG3.6 cells. DAPI (blue) was used to label the nuclei. Scale bar, 50 µm.
Fig. 6
Fig. 6. Clone L2.2-derived cultures express cortical interneuron markers similarly to 5A5- enriched primary interneurons
(A, left panel) Schematic drawing showing expression patterns of RP markers (A2B5 for GRPs; 5A5 for NRPs) and RG marker (BLBP) on coronal sections of E14.5 forebrain. Strong 5A5 staining in the GE labels SVZ progenitors and newly formed neurons (red), whereas the VZ is not labeled but is positive for A2B5 and BLBP (green) (Li et al., 2004). (A, right panel) Confocol image of the boxed region in A showing immunostaining of the VZ/SVZ interface marked by BLBP (green) and 5A5 (red). qPCR analysis of undifferentiated (0 day) and differentiated (1 or 3 days) L2.2 and L2.3 cells was compared to 5A5+/A2B5− acutely isolated, MACS sorted primary cells from E14.5 ventral forebrains in their expression of RG markers and interneuron markers (B), and for interneuron subtype markers (C). The gene expression levels in whole forebrain were set as 1 for reference in (B), and those in L2.3 0 day were set as 1 in (C) where the cycle threshold (Ct) values are also indicated. (D) Western blot analysis showed differential expression of proteins between L2.2 and L2.3 clones after 6-day differentiation in culture. GAPDH was used to normalize the sample loading. (E) qPCR analysis on L2.2 and L2.3 samples and micro-dissected E14.5 cortex and GEs. The gene expression levels in L2.3 0 day were set as 1. “+”s indicate calculations were based on only duplicated samples. (F) Dendrogram showing correlation of different samples was drawn based on the expression of genes in panel E. * indicates expression levels were significantly different from those of references (p<0.05, Students T-test).
Fig. 7
Fig. 7. L2.2 differentiated neurons expressed cortical interneuron markers by immunostaining
(A) After 6-day differentiation in N2B27 medium, L2.2 cells showed immunoreactivity for cortical interneuron markers including GAD, DLX-2, calretinin, calbindin, NPY, somatostatin and TH. DAPI (blue) was used to label nuclei. The percentages of marker positive cells among total cells (DAPI+) in L2.2 culture are shown as mean with standard errors from triplicate experiments in (B). Double immunostaining showed non-overlapping staining pattern between calretinin and calbindin (C). Scale bars, 50 µm.

Similar articles

Cited by

References

    1. Anderson SA, Eisenstat DD, Shi L, Rubenstein JL. Interneuron migration from basal forebrain to neocortex: dependence on Dlx genes. Science. 1997;278:474–476. - PubMed
    1. Anderson SA, Marin O, Horn C, Jennings K, Rubenstein JL. Distinct cortical migrations from the medial and lateral ganglionic eminences. Development. 2001;128:353–363. - PubMed
    1. Anthony TE, Klein C, Fishell G, Heintz N. Radial glia serve as neuronal progenitors in all regions of the central nervous system. Neuron. 2004;41:881–890. - PubMed
    1. Anthony TE, Mason HA, Gridley T, Fishell G, Heintz N. Brain lipid-binding protein is a direct target of Notch signaling in radial glial cells. Genes Dev. 2005;19:1028–1033. - PMC - PubMed
    1. Bernard O, Reid HH, Bartlett PF. Role of the c-myc and the N-myc proto-oncogenes in the immortalization of neural precursors. J Neurosci Res. 1989;24:9–20. - PubMed

Publication types

MeSH terms