. 2008 Dec;36(12):1585-92.
doi: 10.1016/j.exphem.2008.07.001. Epub 2008 Sep 23.

Thrombopoietin regulates c-Myb expression by modulating micro RNA 150 expression

Affiliations

Thrombopoietin regulates c-Myb expression by modulating micro RNA 150 expression

Charlene F Barroga et al. Exp Hematol. 2008 Dec.

Abstract

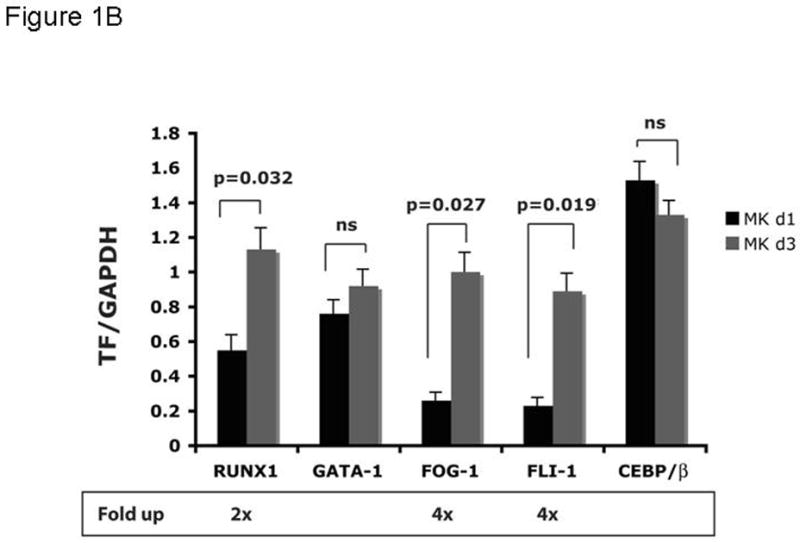
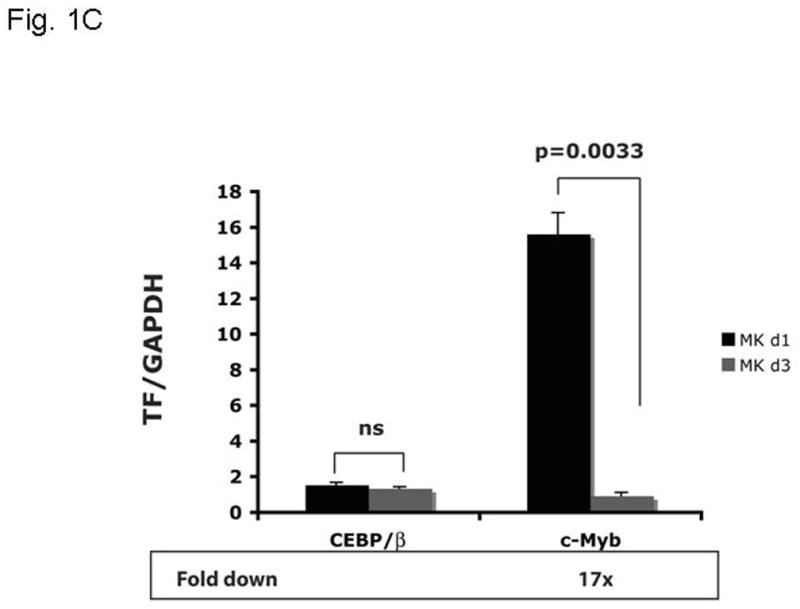
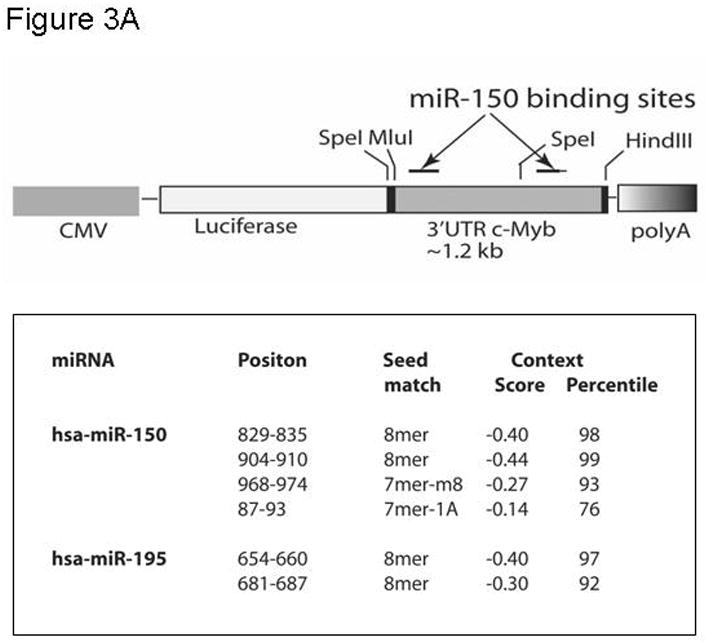
Objective: Mice harboring c-Myb hypomorphic mutations display enhanced thrombopoiesis because of increased numbers of megakaryocytes and their progenitors. Thrombopoietin induces these same effects, which lead us to hypothesize that the hormone acts through modulation of c-Myb expression, as c-Myb levels falls during thrombopoietin-induced megakaryocyte (MK) maturation. Micro RNAs (miRs) downregulate gene expression by binding to the 3' untranslated region (UTR) of specific messenger RNAs (mRNAs); we noted that the 3'UTR of c-Myb contains four miR-150 binding sites.

Materials and methods: We used quantitative reverse transcriptase polymerase chain reaction, Western blotting, and reporter gene analyses to assess the response of c-Myb to thrombopoietin stimulation and to gain of and loss of miR-150 expression.

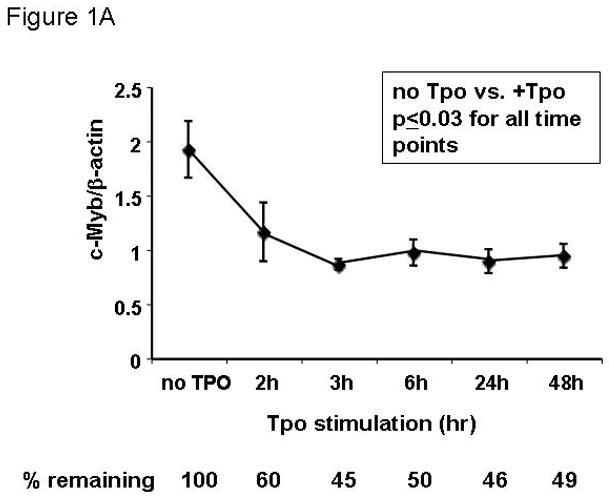
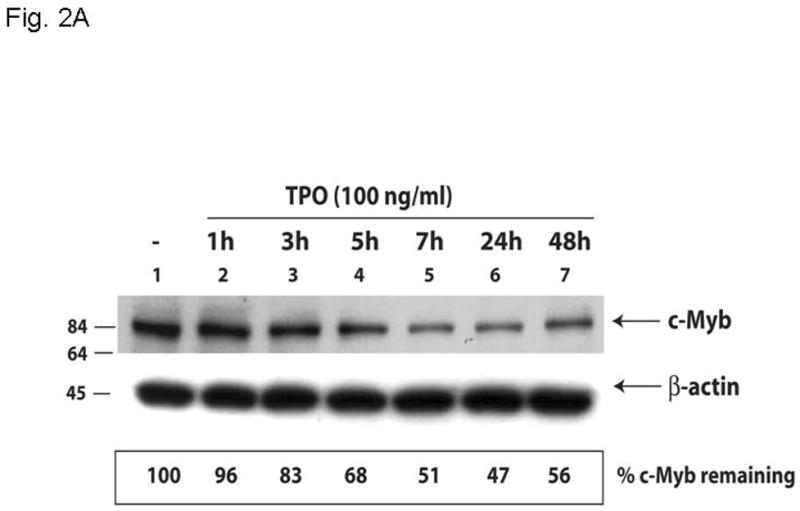
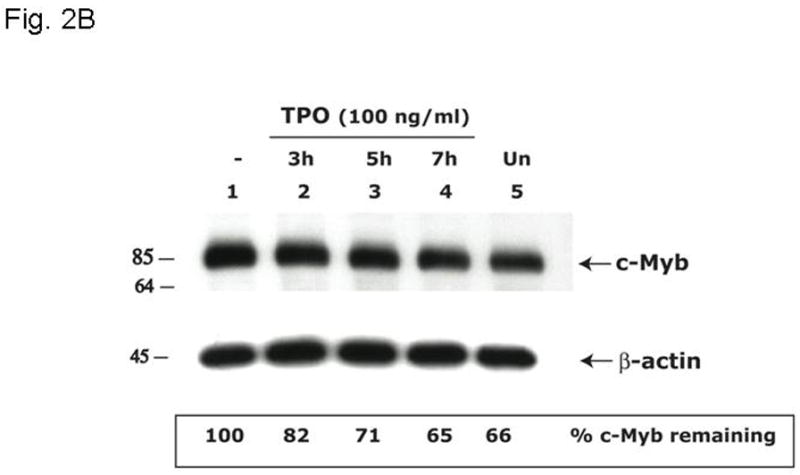
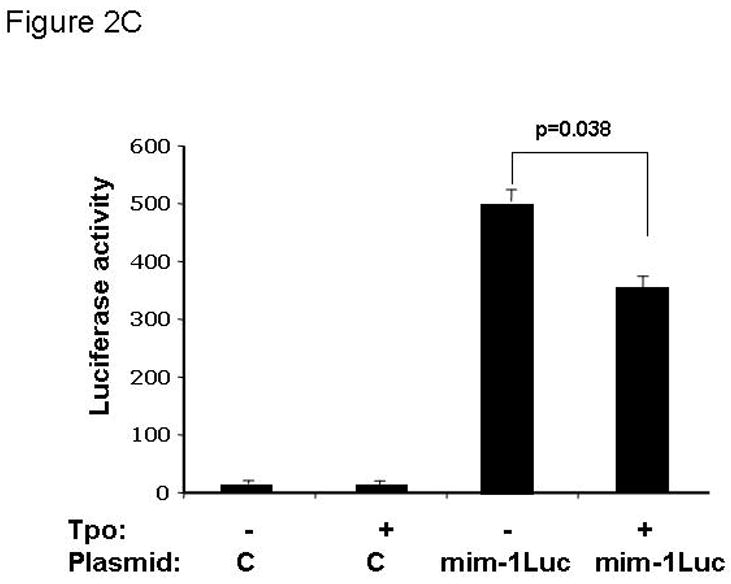
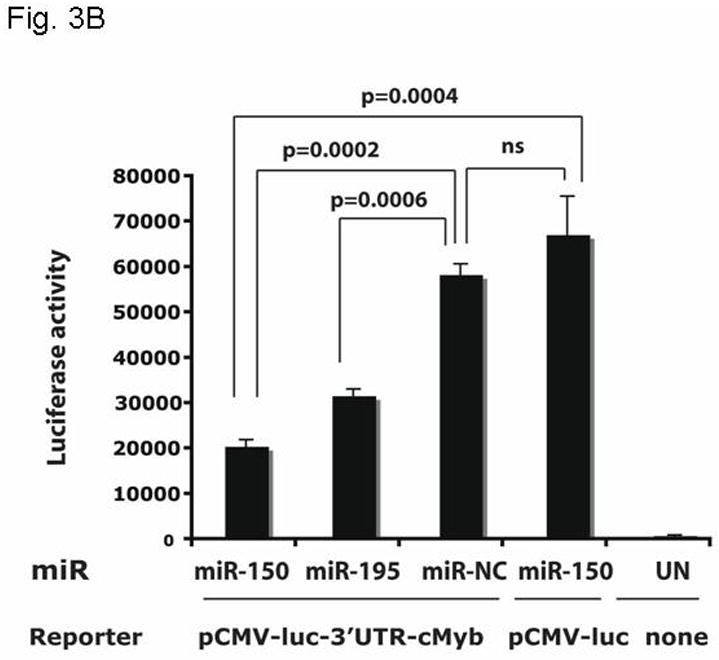
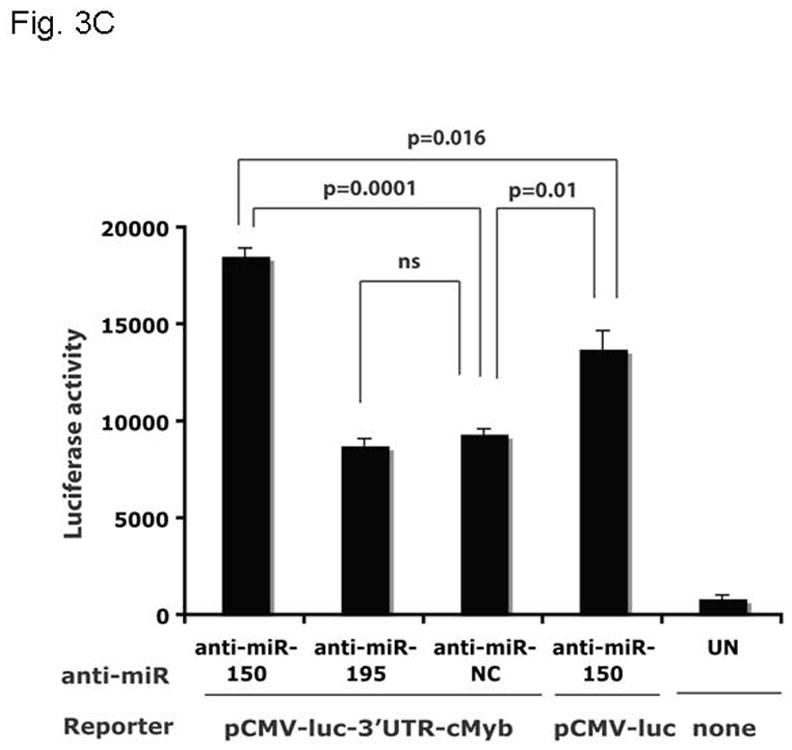
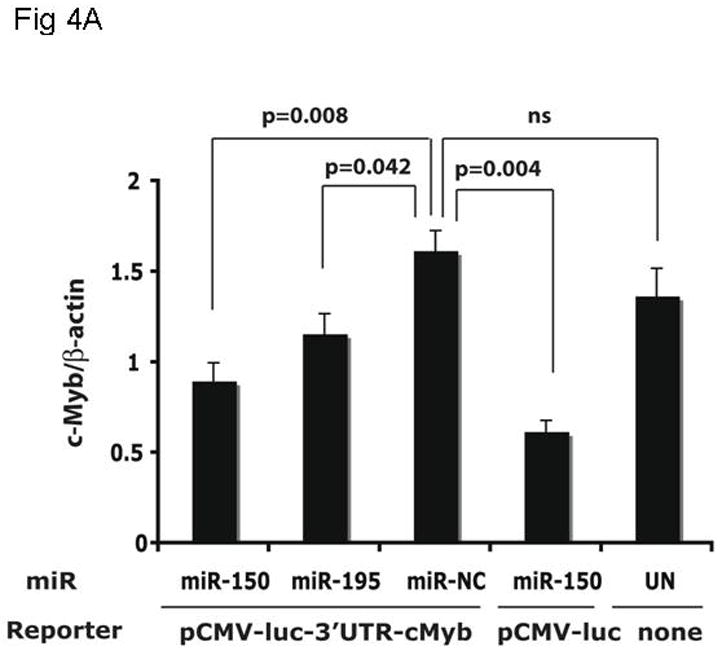
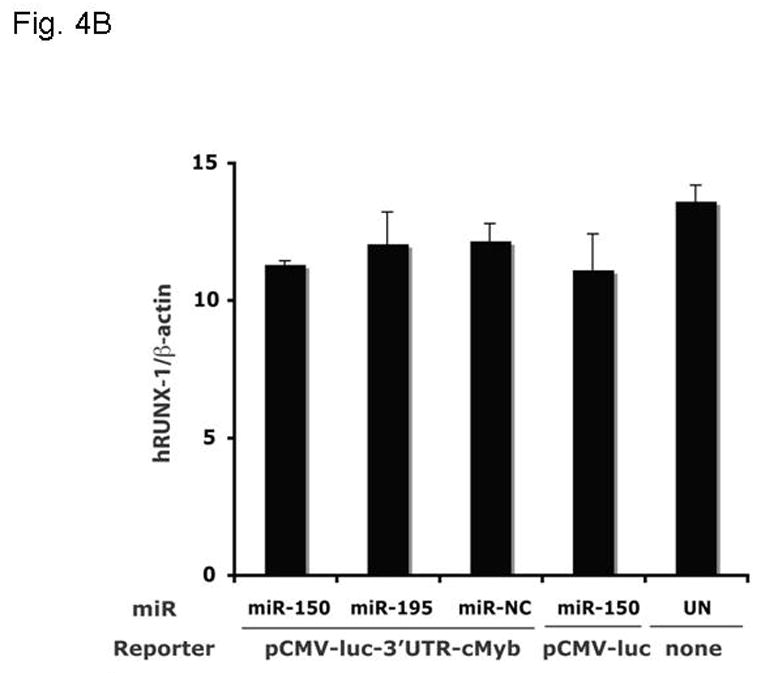
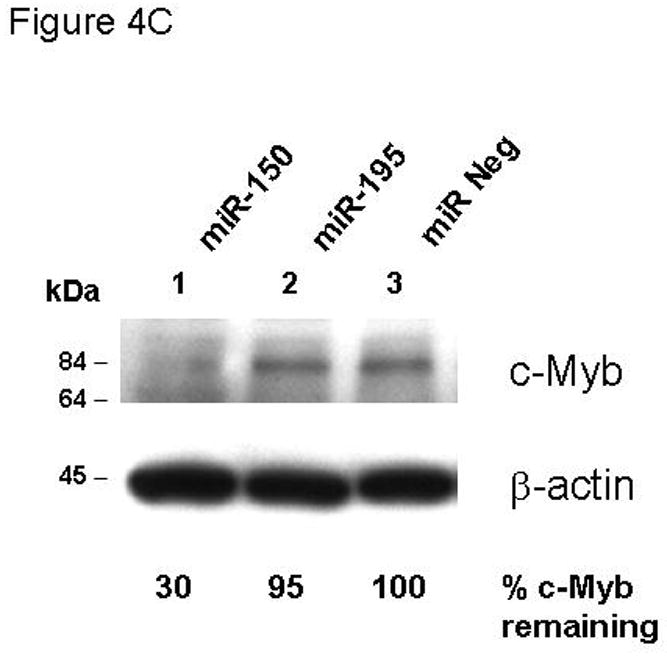
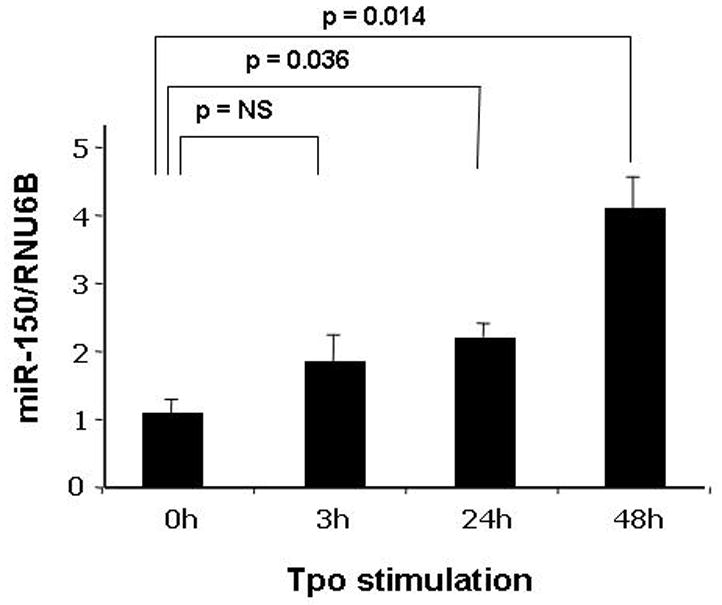
Results: We found that thrombopoietin reduced c-Myb mRNA and protein levels within 7 hours in megakaryocytes and UT7/thrombopoietin (TPO) cells. Using a reporter gene containing the c-Myb 3'UTR region, including its four miR150 binding sites, we found that expression of miR150 reduced luciferase expression to 50% of baseline at 24 hours and to 25% at 48 hours in UT7/TPO cells. Quantitative polymerase chain reaction and Western blotting also revealed that miR-150 reduced endogenous c-Myb mRNA and protein to 50% in UT7/TPO cells, and to 65% in mature megakaryocytes. Converse experiments utilizing anti-miR150 increased luciferase activity twofold over control anti-miR. Finally, TPO increased miR150 expression 1.8-fold within 24 hours and 3.4-fold within 48 hours.

Conclusions: These findings establish that miR150 downmodulates c-Myb levels, and because TPO affects miR150 expression, our results indicate that, in addition to affecting MK progenitor cell growth, TPO downmodulates c-Myb expression through induction of miR-150.


Figures

Figure 1
Figure 1. Expression of c-Myb and other megakaryocytic transcription factors in megakaryocytic cell lines and mature megakaryocytes
UT7/TPO cells (A) were starved for 24h and then stimulated with 100 ng/ml thrombopoietin for up to 48 hr. RNA was extracted and c-Myb levels were assessed by Q-RT-PCR, with β-actin as internal control. Each assay was performed in triplicate. c-Myb levels significantly declined (p≤0.03) for all time points with Tpo stimulation (n=3). Immature murine megakaryocytes (B–C) were induced to differentiate over 2 days with thrombopoietin. RNA was harvested from immature and mature megakaryocytes, and the levels of RUNX1, GATA1, FOG1, Fli1, C/EBPβ and c-Myb were assessed by quantitative real-time PCR with glyceraldehyde dehydrogenase (GAPDH) as an internal control. The results shown are the relative values of signal intensity for the various transcription factors compared to the internal controls. Each experiment was performed in triplicate and the results compared using the t-test for paired values. The results represented in figures 1B and 1C were performed together, but are shown on separate figures due to the range of scales.
Figure 2
Figure 2. Thrombopoietin reduces c-Myb protein and function in UT7/TPO cells and in murine megakaryocytes
A. UT7/TPO cells were starved overnight and then stimulated with 100 ng/ml thrombopoietin for 0–48 hr, cell lysates were prepared, size fractionated, transferred to PVDF membranes and probed for c-Myb. Densitometric analysis revealed a significant decrease in c-Myb protein levels at 5h–48h (p≤0.01 for all time points). The fraction of c-Myb remaining is shown, along with a representative western blot. B. Mature murine megakaryocytes were produced by marrow cell culture in thrombopoietin and the cells purified by BSA gradient and starved for 20 hr in StemPro serum-free medium. The cells were then cultured in 100 ng/ml thrombopoietin for up to 7 hr, cell lysates prepared and subjected to western blotting for c-Myb and β-actin,. Densitometric analyses (n=3) showed c-Myb protein levels were significantly decreased at 5–7h (p≤0.01). The fraction of c-Myb remaining is shown, along with a representative western blot. C. The c-Myb responsive reporter construct c-mim-luc (mim1Luc), which contains three c-Myb response elements was introduced into UT7/TPO cells and following overnight starvation was cultured an additional 5 hr with thrombopoietin or control culture medium. Sham transfected cells served as a control (C). The data represent the mean of three experiments. The difference between thrombopoietin and no thrombopoietin in c-mim1-luc transduced cultures achieved statistical significance (p=0.038).
Figure 3
Figure 3. miR150 affects a c-Myb 3′ UTR reporter gene
A. The pCMV-luc-3′UTRc-Myb reporter gene is illustrated [with the list of miR binding sites]. The construct was generated by introducing the 1.2 kb 3′UTR of c-Myb into pMIR-Report-luc. B. pCMV-luc-3′UTRc-Myb was transfected into UT7/TPO cells with miR150, miR195 or a negative miR control. After 24 hr, luciferase activity was assessed in duplicate cultures. Values reported are the mean ± S.E.M. of three separate experiments and reported as relative luciferase activity between the various conditions. The same vector, but without the 3′UTR of c-myb (pCMV-luc), were also utilized as controls, and results are shown. C. pCMV-luc-3′UTRc-Myb was transfected into UT7/TPO cells with anti-miR150, anti-miR195 or a negative anti-miR control. After 24 hr luciferase activity was assessed in duplicate cultures and is reported as the mean ± S.E.M. of three separate experiments. The same controls as in figure 3B were performed. pCMV-luc-3′UTRc-Myb was also transfected into the cells with miR negative control and anti-miR negative control, and these gave the same values as the vector without the 3′UTRcMyb (data not shown).
Figure 4
Figure 4. miR150 affects c-Myb expression
The same cultures assessed for reporter gene activity in Figure 3B were also assayed for expression of the endogenous c-Myb (A,C) and RUNX-1 (B) genes using Q-RT-PCR (A,B) and quantitative western blotting (C).
Figure 4
Figure 4. miR150 affects c-Myb expression
The same cultures assessed for reporter gene activity in Figure 3B were also assayed for expression of the endogenous c-Myb (A,C) and RUNX-1 (B) genes using Q-RT-PCR (A,B) and quantitative western blotting (C).
Figure 4
Figure 4. miR150 affects c-Myb expression
The same cultures assessed for reporter gene activity in Figure 3B were also assayed for expression of the endogenous c-Myb (A,C) and RUNX-1 (B) genes using Q-RT-PCR (A,B) and quantitative western blotting (C).
Figure 5
Figure 5. Thrombopoietin affects miR-150 expression
A Q-RT-PCR assay for miR-150 using the RNU6B control microRNA as an internal control was developed and used to assess the miR-150 cellular response to stimulation with thrombopoietin. We found that UT-7/TPO cells stimulated for 3–48 hr with the hormone up-regulated miR-150 expression substantially and significantly. The results represent the mean ± S.E.M. of three independent experiments with assays performed in triplicate.

References

    1. Kaushansky K. The molecular mechanisms that control thrombopoiesis. J Clin Invest. 2005;115:3339–3347. - PMC - PubMed
    1. Ramsey RG. c-Myb a stem-progenitor cell regulator in multiple tissue compartments. Growth Factors. 2005;23:253–261. - PubMed
    1. Ganter B, Chao ST, Lipsick JS. Transcriptional activation by the Myb proteins requires a specific local promoter structure. FEBS Lett. 1999;460:401–410. - PubMed
    1. Emambokus N, Vegiopoulos A, Harman B, Jenkinson E, Anderson G, Frampton Progression through key stages of haemopoiesis is dependent on distinct threshold levels of c-Myb. EMBO J. 2003;22:4478–4488. - PMC - PubMed
    1. Friedman AD. Runx1, c-Myb, and C/EBPalpha couple differentiation to proliferation or growth arrest during hematopoiesis. J Cell Biochem. 2002;86:624–629. - PubMed

Publication types

MeSH terms