. 2008 Oct;27(10):1495-505.
doi: 10.1109/TMI.2008.923966.

Intraretinal layer segmentation of macular optical coherence tomography images using optimal 3-D graph search

Affiliations

Intraretinal layer segmentation of macular optical coherence tomography images using optimal 3-D graph search

Mona K Garvin et al. IEEE Trans Med Imaging. 2008 Oct.

Abstract

Current techniques for segmenting macular optical coherence tomography (OCT) images have been 2-D in nature. Furthermore, commercially available OCT systems have only focused on segmenting a single layer of the retina, even though each intraretinal layer may be affected differently by disease. We report an automated approach for segmenting (anisotropic) 3-D macular OCT scans into five layers. Each macular OCT dataset consisted of six linear radial scans centered at the fovea. The six surfaces defining the five layers were identified on each 3-D composite image by transforming the segmentation task into that of finding a minimum-cost closed set in a geometric graph constructed from edge/regional information and a priori determined surface smoothness and interaction constraints. The method was applied to the macular OCT scans of 12 patients (24 3-D composite image datasets) with unilateral anterior ischemic optic neuropathy (AION). Using the average of three experts' tracings as a reference standard resulted in an overall mean unsigned border positioning error of 6.1 +/- 2.9 microm, a result comparable to the interobserver variability (6.9 +/- 3.3 microm). Our quantitative analysis of the automated segmentation results from AION subject data revealed that the inner retinal layer thickness for the affected eye was 24.1 microm (21%) smaller on average than for the unaffected eye (p < 0.001), supporting the need for segmenting the layers separately.


Figures

Fig 1
Fig 1
Schematic view of the macular (a–c) and circular (d–f) scanning protocols on time-domain OCT systems. (a) Scans in macular series on the right eye. (N = nasal; T = temporal.) (b) Scans in macular series on the left eye. (c) Visualization of acquired macular scans for one eye in 3-D. Each color represents a different 2-D scan. (d) Scans in peripapillary circular series on the right eye. (e) Scans in peripapillary circular series on the left eye. (f) Visualization of acquired circular scans for one eye in 3-D.
Fig 2
Fig 2
Example six raw scans in a macular scan series. Note that the colored borders correspond to those found in Fig. 1(a)–(c)
Fig 3
Fig 3
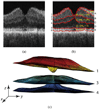
Example composite image with labeled intralayer segmentation and 3-D visualization of three surfaces (top and bottom of images have been cropped to aid in visualization). (a) Composite image. (b) Six surfaces (labeled 1–6) and five corresponding intralayers (labeled A–E). The anatomical correspondence is our current presumption based on histology and example images from higher-resolution research OCT scanners [12]: (A) NFL (nerve fiber layer), (B) GCL + IPL (ganglion cell layer and inner plexiform layer), (C) INL+OPL (inner nuclear layer and outer plexiform layer), (D) ONL + IS (outer nuclear layer and photoreceptor inner segments), (E) OS (photoreceptor outer segments). (c) Example 3-D visualization of surfaces 1, 3, and 4.
Fig 4
Fig 4
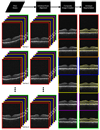
Overview of segmentation steps for the data associated with one eye. First, each individual scan was aligned so that the RPE (boundary 6) was approximately horizontal in the image. Second, images from each location were registered and averaged to form a composite image. Finally, the intralayer surfaces were determined using a 3-D graph-search approach. All steps were performed automatically.
Fig 5
Fig 5
Individual scan alignment (top and bottom of images have been cropped to aid in visualization).
Fig 6
Fig 6
Comparison between an individual scan and a 2-D composite scan (top and bottom of images have been cropped to aid in visualization). (a) Individual scan. (b) Composite scan.
Fig 7
Fig 7
Example of using a SRAD method as a preprocessing step (top and bottom of images have been cropped to aid in visualization). (a) Composite scan. (b) Composite scan after application of the SRAD method.
Fig 8
Fig 8
Schematic view of neighbor relationship for 3-D macular OCT segmentation. The edges indicate neighborhood connectivity of one “column” of z values at a (r; θ) pair to another. For each edge shown, smoothness constraints existed between corresponding voxel z columns for the two (r; θ) pairs connected to the edge. (a) Base graph using cylindrical coordinates. (b) Base graph using unwrapped coordinate system (as might be stored in the computer).
Fig 9
Fig 9
Some examples for where the image information comes from in a regional cost function term. Dark borders represent surrounding surfaces (may not be known) of the surface for which the cost function term is being defined. In cases for which an upper or lower surrounding surface does not exist (i.e., the first and last surfaces), the corresponding dark border represents the boundary of the image.
Fig 10
Fig 10
Bar chart of mean thickness differences (error bars reflect standard deviations).
Fig 11
Fig 11
Three example results reflecting the best, median, and worst performances according to the overall unsigned border positioning error. (a) Best case composite image. (b) Best case composite image with segmented borders. (c) Best case composite image with average manual tracing. (d) Median case composite image. (e) Median case composite image with segmented borders. (f) Median case composite image with average manual tracing. (g) Worst case composite image. (h) Worst case composite image with segmented borders. (i) Worst case composite image with average manual tracing.
Fig 12
Fig 12
Summary of thickness values based on our intraretinal layer segmentation approach. The thickness differences between the affected and unaffected eyes were largest on average for the inner retinal layer. Inner layer used in (a) contains the retinal ganglion cells and axons.

References

    1. Huang D, Swanson EA, Lin CP, Schuman JS, Stinson WG, Chang W, Hee MR, Flotte T, Gregory K, Puliafito CA. Optical coherence tomography. Science. 1991 Nov.vol. 254(no. 5035):1178–1181. - PMC - PubMed
    1. Koozekanani D, Boyer K, Roberts C. Retinal thickness measurements in optical coherence tomography using a Markov boundary model; Proc. IEEE Conf. Comput. Vis. Pattern Recognit. (CVPR); 2000. Jun. pp. 363–370.
    1. Koozekanani D, Boyer K, Roberts C. Retinal thickness measurements from optical coherence tomography using a Markov boundary model. IEEE Trans. Med. Imag. 2001 Sep.vol. 20(no. 9):900–916. - PubMed
    1. Ishikawa H, Stein DM, Wollstein G, Beaton S, Fujimoto JG, Schuman JS. Macular segmentation with optical coherence tomography. Investigative Ophthalmol. Vis. Sci. 2005 Jun.vol. 46(no. 6):2012–2017. - PMC - PubMed
    1. Chan A, Duker JS, Ishikawa H, Ko TH, Schuman JS, Fujimoto JG. Quantification of photoreceptor layer thickness in normal eyes using optical coherence tomography. Retina. 2006;vol. 26(no. 6):655–660. - PMC - PubMed

Publication types

MeSH terms