Comparative Study
. 2008 Dec;295(6):R2041-9.
doi: 10.1152/ajpregu.90541.2008. Epub 2008 Sep 24.

Rapid changes in glutamate levels in the posterior hypothalamus across sleep-wake states in freely behaving rats

Affiliations
Comparative Study

Rapid changes in glutamate levels in the posterior hypothalamus across sleep-wake states in freely behaving rats

Joshi John et al. Am J Physiol Regul Integr Comp Physiol. 2008 Dec.

Abstract

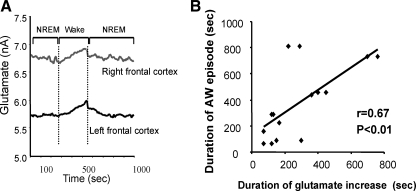
The histamine-containing posterior hypothalamic region (PH-TMN) plays a key role in sleep-wake regulation. We investigated rapid changes in glutamate release in the PH-TMN across the sleep-wake cycle with a glutamate biosensor that allows the measurement of glutamate levels at 1- to 4-s resolution. In the PH-TMN, glutamate levels increased in active waking (AW) and rapid eye movement (REM) sleep compared with quiet waking and nonrapid eye movement (NREM) sleep. There was a rapid (0.6 +/- 1.8 s) and progressive increase in glutamate levels at REM sleep onset. A reduction in glutamate levels consistently preceded the offset of REM sleep by 8 +/- 3 s. Short-duration sleep deprivation resulted in a progressive increase in glutamate levels in the PH-TMN, perifornical-lateral hypothalamus (PF-LH), and cortex. We found that in the PF-LH, glutamate levels took a longer time to return to basal values compared with the time it took for glutamate levels to increase to peak values during AW onset. This is in contrast to other regions we studied in which the return to baseline values after AW was quicker than their rise with waking onset. In summary, we demonstrated an increase in glutamate levels in the PH-TMN with REM/AW onset and a drop in glutamate levels before the offset of REM. High temporal resolution measurement of glutamate levels reveals dynamic changes in release linked to the initiation and termination of REM sleep.


Figures

Fig. 1.
Fig. 1.
Calibration of glutamate sensor was performed (in vitro) before in vivo implantation. A linear change in the current was seen with glutamate (10 μM) over the concentration range of 0–50 μM in the representative example presented here. A rapid (1- to 4-s) response in the sensor varying from 3.2 to 5.5 nA/10 μM glutamate was obtained.
Fig. 2.
Fig. 2.
Location of glutamate sensors. A: photomicrograph of the posterior hypothalamic region showing the location of the glutamate sensor. Arrow indicates the location of the tip of the sensor. Location of the glutamate sensors (•) and microdialysis probes (○) in stereotaxic planes of rat brain through the posterior hypothalamus histaminergic tuberomammillary nucleus (PH-TMN; B) and glutamate sensors (•) in the perifornical-lateral hypothtlamus (PF-LH; C) and the cortex (D). Scale bar = 1 mm; scale bar B is the same for C and D. 3V, third ventricle; cc, corpus callosum; f, fornix.
Fig. 3.
Fig. 3.
Changes in glutamate levels in the PH-TMN with the onset and offset of rapid eye movement (REM) sleep. A: representative graph showing average glutamate values ± SE of 8 REM sleep episodes (mean duration 120 ± 14.8 s) recorded from one animal. Glutamate levels increased with REM sleep onset and decreased before REM sleep offset [F = 4.1, degrees of freedom (df) 7,224, P < 0.0001, one-way ANOVA; *P < 0.05 and **P < 0.01 compared with prior nonrapid eye movement (NREM) sleep levels; Fisher's least-significant difference (LSD)]. a, Time point of “start” of glutamate increase; b, time point of glutamate “peak”; c, time point of glutamate “drop”; d, time point of glutamate return to basal levels. B: duration of REM sleep and the duration of increased glutamate level significantly correlated.
Fig. 4.
Fig. 4.
Changes in glutamate levels are shown at REM sleep onset and offset. Average glutamate levels from different brain regions with REM sleep onset (top) and offset (bottom). Calibration bars: electroencephalogram (EEG), 50 μV; electromyogram (EMG), 100 μV. QW, quiet waking.
Fig. 5.
Fig. 5.
Changes in glutamate levels are shown with active wake (AW) onset and offset. Average glutamate levels from different brain regions with AW onset (top) and offset (bottom). Calibration bars: EEG, 50 μV; EMG, 100 μV.
Fig. 6.
Fig. 6.
Changes in glutamate levels in the PH-TMN during AW. A: duration of AW and duration of increased glutamate levels were significantly correlated. B: amount of glutamate increase was correlated with the duration of AW.
Fig. 7.
Fig. 7.
Microdialysis and glutamate sensor data were collected simultaneously from the PH-TMN. Changes in glutamate levels with microdialysis-HPLC analysis of samples collected every 5 min is given in top while time-matched data (collected every s) obtained from the glutamate sensor is on bottom. Increased glutamate level measured with the glutamate sensor corresponds to increased glutamate level measured in the microdialysis samples.
Fig. 8.
Fig. 8.
Changes in glutamate levels in the PF-LH during AW period. A: glutamate levels increased with AW and decreased with QW/NREM sleep. B: duration of AW and duration of increased glutamate levels were significantly correlated.
Fig. 9.
Fig. 9.
Changes in glutamate levels in the frontal cortex during AW. A: glutamate levels increased in the left and right frontal cortex (recorded simultaneously) with AW and decreased with QW/NREM sleep. B: duration of AW and duration of increased glutamate levels were significantly correlated.

References

    1. Abrahamson EE, Leak RK, Moore RY. The suprachiasmatic nucleus projects to posterior hypothalamic arousal systems. NeuroReport 12: 435–440, 2001. - PubMed
    1. Albrecht J, Hilgier W, Zielinska M, Januszewski S, Hesselink M, Quack G. Extracellular concentrations of taurine, glutamate, and aspartate in the cerebral cortex of rats at the asymptomatic stage of thioacetamide-induced hepatic failure: modulation by ketamine anesthesia. Neurochem Res 25: 1497–1502, 2000. - PubMed
    1. Bettendorff L, Sallanon-Moulin M, Touret M, Wins P, Margineanu I, Schoffeniels E. Paradoxical sleep deprivation increases the content of glutamate and glutamine in rat cerebral cortex. Sleep 19: 65–71, 1996. - PubMed
    1. Blanco-Centurion C, Gerashchenko D, Shiromani PJ. Effects of saporin-induced lesions of three arousal populations on daily levels of sleep and wake. J Neurosc 27: 14041–8, 2007. - PMC - PubMed
    1. Brown RE, Stevens DR, Haas HL. The physiology of brain histamine. Prog Neurobiol 63: 637–72, 2001. - PubMed

Publication types

LinkOut - more resources