. 2008 Sep 24;28(39):9741-54.
doi: 10.1523/JNEUROSCI.0458-08.2008.

Absence of 2-hydroxylated sphingolipids is compatible with normal neural development but causes late-onset axon and myelin sheath degeneration

Affiliations

Absence of 2-hydroxylated sphingolipids is compatible with normal neural development but causes late-onset axon and myelin sheath degeneration

Inge Zöller et al. J Neurosci. .

Abstract

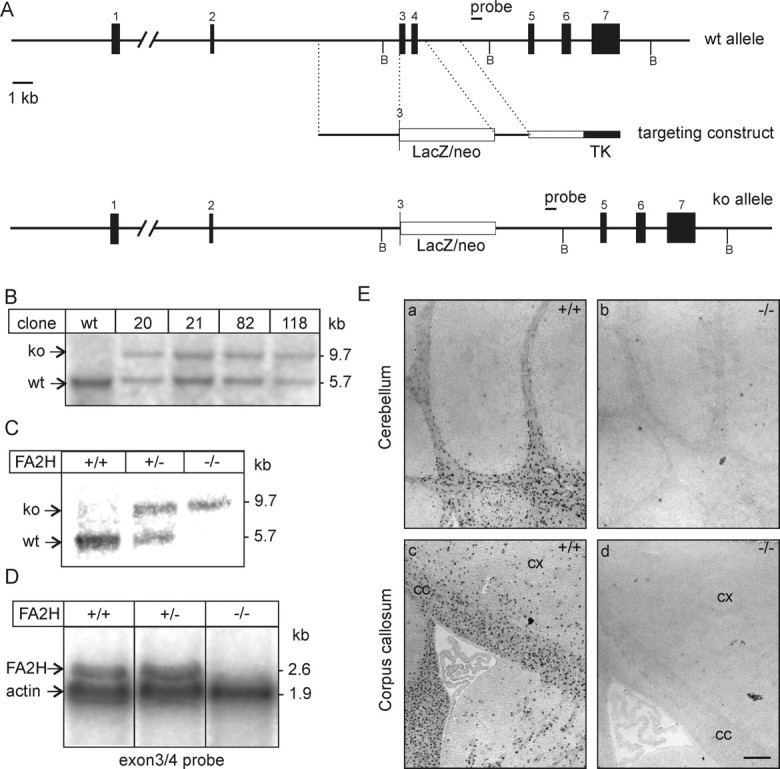
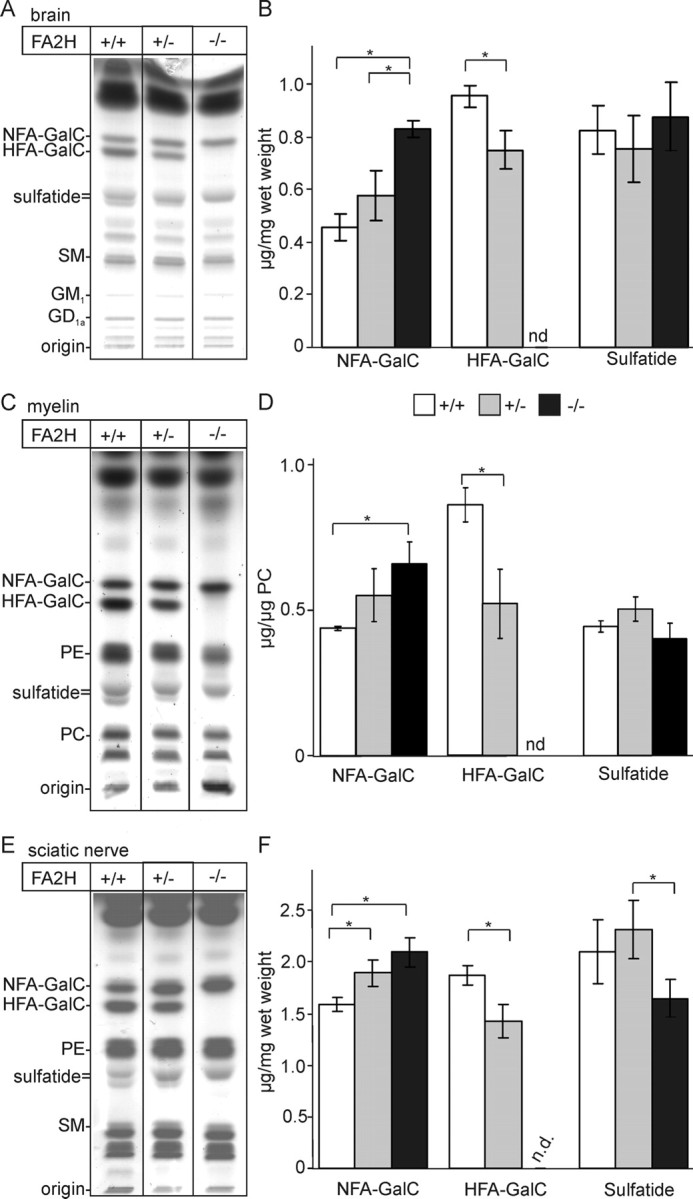
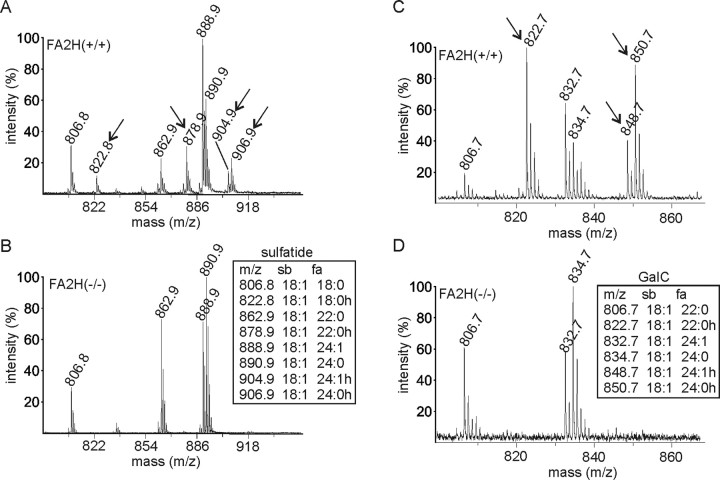
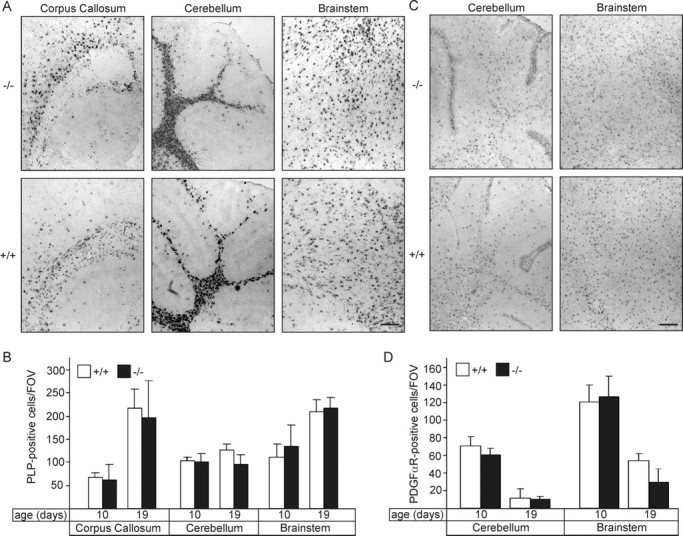
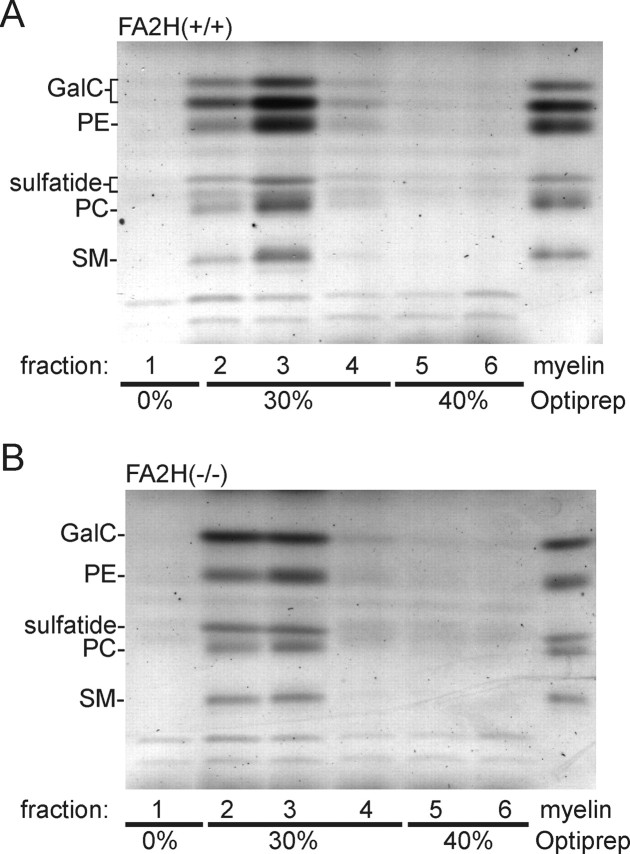
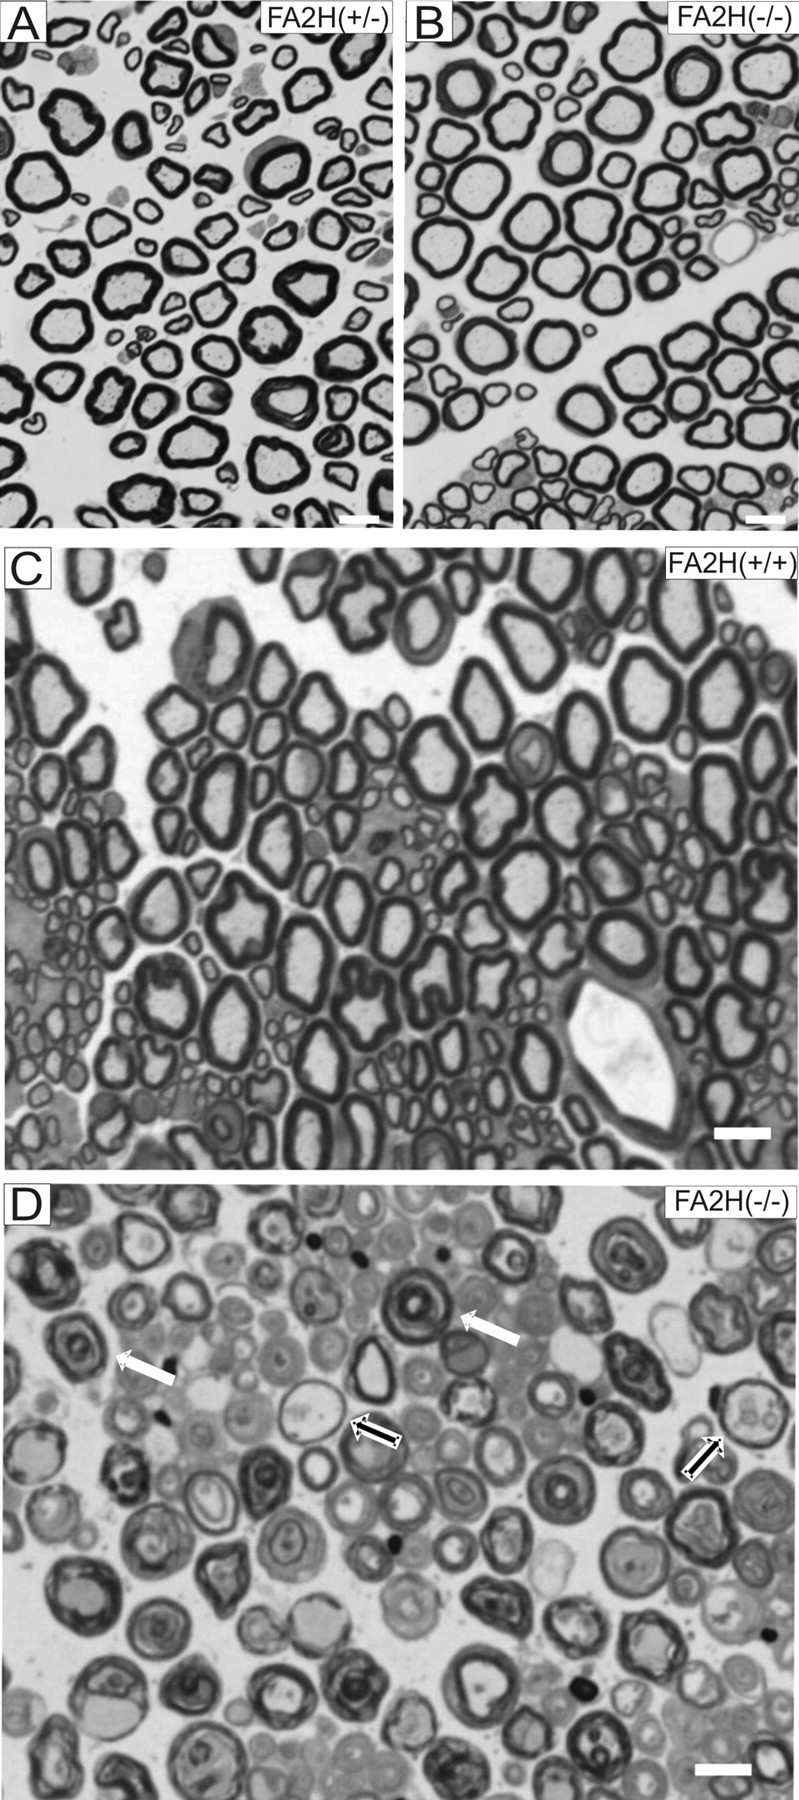
Sphingolipids containing 2-hydroxylated fatty acids are among the most abundant lipid components of the myelin sheath and therefore are thought to play an important role in formation and function of myelin. To prove this hypothesis, we generated mice lacking a functional fatty acid 2-hydroxylase (FA2H) gene. FA2H-deficient (FA2H(-/-)) mice lacked 2-hydroxylated sphingolipids in the brain and in peripheral nerves. In contrast, nonhydroxylated galactosylceramide was increased in FA2H(-/-) mice. However, oligodendrocyte differentiation examined by in situ hybridization with cRNA probes for proteolipid protein and PDGFalpha receptor and the time course of myelin formation were not altered in FA2H(-/-) mice compared with wild-type littermates. Nerve conduction velocity measurements of sciatic nerves revealed no significant differences between FA2H(-/-) and wild-type mice. Moreover, myelin of FA2H(-/-) mice up to 5 months of age appeared normal at the ultrastructural level, in the CNS and peripheral nervous system. Myelin thickness and g-ratios were normal in FA2H(-/-) mice. Aged (18-month-old) FA2H(-/-) mice, however, exhibited scattered axonal and myelin sheath degeneration in the spinal cord and an even more pronounced loss of stainability of myelin sheaths in sciatic nerves. These results show that structurally and functionally normal myelin can be formed in the absence of 2-hydroxylated sphingolipids but that its long-term maintenance is strikingly impaired. Because axon degeneration appear to start rather early with respect to myelin degenerations, these lipids might be required for glial support of axon function.


Figures

Figure 1.
Figure 1.
Generation of FA2H-deficient mice. A, Schematic representation of the FA2H wild-type allele, structure of the targeting vector, and targeted allele. Restriction sites for BglII (B) are indicated. B, Southern blot analysis of FA2H+/− ES cell clones, which survived G418/ganciclovir selection. Genomic DNA was digested with BglII and hybridized to the 3′ external probe, indicated in A. A nontargeted ES cell clone (wt) was included as control. ko, Knock-out. C, Southern blot analysis of FA2H alleles from mouse tail genomic DNA digested with BglII. D, Northern blot analysis of FA2H expression. Brain total RNA (20 μg/lane) of 6-week-old FA2H+/+, FA2H+/−, and FA2H−/− mice was separated in 1 m formaldehyde/1% agarose gels and transferred onto nylon membranes. Membranes were simultaneously hybridized to [32P]-labeled FA2H (derived from exons 3 and 4) and β-actin probes. Bound probes were visualized by autoradiography on x-ray films. E, In situ hybridization. Parasagittal sections of 4-week-old mouse brain of FA2H+/+ (a, c) and FA2H−/− (b, d) tissue sections were hybridized to a DIG-labeled FA2H-antisense probe. Shown are the hybridization signals in cerebellum (a, b) and forebrain (c, d). No FA2H mRNA-positive cells were observed in brain sections of FA2H−/− mice. cx, Cortex; cc, corpus callosum. Scale bar, 200 μm.
Figure 2.
Figure 2.
β-Galactosidase expression in FA2H+/− mice. a, b, c, d, Parasagittal brain sections of brains from 1-week-old (a), 2-week-old (b), 3-week-old (c), and 4-week-old (d) FA2H+/− mice were stained for β-galactosidase using X-Gal. d, e, f, β-Galactosidase was absent from FA2H+/+ controls (e) and was increased in FA2H−/− mice (f) compared with FA2H+/− (d). h, Control in situ hybridization with DIG-labeled FA2H cRNA antisense probes gave identical expression patterns as the β-galactosidase. g, Control in situ hybridizations with sense probes gave no signals.
Figure 3.
Figure 3.
Lipid analysis. A, Lipids were isolated from total brain of FA2H+/+, FA2H+/−, and FA2H−/− mice at 28 d of age. Total lipids were subjected to mild alkaline methanolysis to remove phospholipids and separated by TLC on silica gel 60 TLC plates using chloroform/methanol/water (60:27:4; v/v/v) as solvent system (the amount of lipids corresponding to 1 mg wet weight of tissue was applied per lane). Lipids were visualized with cupric sulfate in aqueous phosphoric acid. B, NFA–GalC, HFA–GalC, and sulfatide were quantified by densitometry and are shown as microgram lipid per milligram wet weight (mean ± SD, n = 3). *p < 0.05, statistically significant difference (t test). C, Myelin was purified from total brains of FA2H+/+, FA2H+/−, and FA2H−/− mice at 10 weeks of age, and total lipids were isolated from the purified myelin. Lipids were separated by TLC (the amount of lipids corresponding to 0.5 mg of myelin was loaded) and quantified by densitometry. D, GalC and sulfatide levels were normalized to phosphatidyl choline (PC). E, Lipids were isolated from the sciatic nerves of FA2H+/+, FA2H+/−, and FA2H−/− mice at 28 d of age. F, Lipids were separated by TLC and quantified as described above (the amount of lipids corresponding to 0.5 mg wet weight of sciatic nerves was applied per lane). Positions of standard lipids run on the same TLC plate are indicated on the left (in A, C, E) (SM, sphingomyelin; gangliosides, GM1, GD1a; PE, phosphatidyl ethanolamine; PC, phosphatidyl choline). nd, Not detectable.
Figure 4.
Figure 4.
MALDI-TOF mass spectrometry. A–D Alkaline stable lipids isolated from the brain of FA2H+/+ (A, C) and FA2H−/− (B, D) mice were subjected to MALDI-TOF mass spectrometry in negative (A, B) or positive (C, D) ion mode, to detect sulfatide (A, B) and GalC (C, D), respectively. Mass to charge ratios (m/z) of individual sulfatide and GalC species are shown in the insets. Hydroxylated sulfatide and GalC species were not detectable in FA2H−/− mice. Mass peaks that correspond to hydroxylated lipids and are missing in FA2H−/− mice are indicated by arrows in A and C. sb, Sphingosine base; fa, fatty acid; h, hydroxylated. Hydroxylated sphingolipids were undetectable in samples of FA2H−/− mice.
Figure 5.
Figure 5.
Analysis of myelin markers. A, MBP Western blot analysis of total brain homogenates (50 μg/lane) from FA2H+/+, FA2H+/−, and FA2H−/− mice of different age groups. Membranes were stained with anti-MBP antiserum recognizing all MBP isoforms and anti-actin antibody to control for equal loading. B, Bound antibodies were detected by enhanced chemiluminescence. Densitometric quantification of MBP levels. Linear exposures of x-ray films were scanned, and the intensities of FA2H+/+ were set to 100%. Shown are the mean ± SD (n = 6 for P10; n = 3 for P19–P70). No significant differences between the three genotypes were observed. C, Western blot analysis of CNP. Brain homogenates of the indicated genotypes and ages were stained with anti-CNP antibody and anti-actin antibody as loading control. D, Western blot analysis of L-MAG and NCAM in 70-d-old brain homogenates. Relative protein levels (normalized to actin) of L-MAG and NCAM-120 are shown on the right (n = 3). E, Ratio of S-MAG and L-MAG expression levels at P10 and P28 was determined by RT-PCR. Intensities of ethidium bromide-stained PCR products were measured (n = 3). F, Quantitative real-time RT-PCR of MBP, PLP, and MAL expression (normalized to actin expression) at P10 and P28 and in adult FA2H−/− and FA2H+/+ mouse brains (12 weeks) showed upregulation of these myelin genes during the period of myelination, as expected. However, no statistically significant differences in their expression levels were observed at any time point examined (mean ± SEM; n = 3–5).
Figure 6.
Figure 6.
Oligodendrocyte differentiation in FA2H−/− mice. A, Parasagittal sections of brains from FA2H+/+ and FA2H−/− mice (10 and 19 d of age) were hybridized to a DIG-labeled PLP cRNA probe. Shown are representative stainings of the corpus callosum, cerebellum, and brainstem of 10-d-old mice. B, Quantification of PLP mRNA-positive cells [number of cells per field of view (FOV)] at P10 and P19 in the corpus callosum, cerebellum, and brainstem of FA2H+/+ and FA2H−/− mice (mean ± SEM; n = 3). No significant differences were found between FA2H+/+ and FA2H−/− mice. C, Parasagittal sections of brains from FA2H+/+ and FA2H−/− mice (10 and 19 d of age) were hybridized to a DIG-labeled PDGFα receptor cRNA probe. Shown are representative stainings of the cerebellum and brainstem of 10-d-old mice. D, Quantification of PDGFα receptor mRNA-positive cells (per field of view) at P10 and P19 in the cerebellum and the brainstem of FA2H+/+ and FA2H−/− mice (mean ± SEM; n = 3). No significant differences between genotypes were observed. Scale bars, 200 μm.
Figure 7.
Figure 7.
Myelin lacking 2-hydroxylated sphingolipids is resistant to extraction with CHAPS. Purified myelin from 10-week-old wild-type (A) and FA2H−/− (B) mice was extracted with 20 mm CHAPS for 30 min at 37°C, followed by flotation in an Optiprep density gradient. Six fractions were collected from the top (fraction 1) to the bottom (fraction 6). Lipids were isolated from each fraction and analyzed by TLC. Lipids from myelin not extracted with CHAPS was loaded on the last lane (myelin). Shown is one representative experiment (of 5 independent experiments). Similar results were obtained when myelin was extracted at 4 or 25°C (data not shown). PE, Phosphatidylethanolamine; PC, phosphatidylcholine; SM, sphingomyelin.
Figure 8.
Figure 8.
Analysis of paranodal length of Paranodin/Caspr clusters. A, Longitudinal cryosections of optic nerves of FA2H+/+ and FA2H−/− mice (6–7 months of age) were stained for Paranodin/Caspr. B, The length and distance between pairs of Paranodin/Caspr clusters were measured. Shown are the mean ± SD (n = 20; 3 animals per genotype). No significant differences were observed. C, Teased fibers of sciatic nerves of FA2H+/+ and FA2H−/− mice were stained for Paranodin/Caspr (red) and sodium channel (green). D, The length and distance between pairs of Paranodin/Caspr clusters were measured. Shown are the mean ± SD (n = 7). No significant differences in the length and distance between Paranodin/Caspr clusters were detected. Scale bars: A, C, 5 μm.
Figure 9.
Figure 9.
Ultrastructural analysis of myelin. A, B, Electron microscopy of cross sections of the optic nerve of adult (5-month-old) FA2H−/− (A) and FA2H+/+ (B) mice. C, At higher magnification, normal structure of compacted myelin and periaxonal spacing were observed (C). D, E, Electron microscopy of the nervus trigeminus of 5-month-old FA2H−/− and FA2H+/+ mice. F, Myelinated axon of nervus ischiadicus of a FA2H−/− mouse displaying normal compacted myelin and periaxonal spacing. G, H, Normal compacted myelin in nervus trigeminus of FA2H−/− and FA2H+/+ mice, respectively. Scale bars: A, B, 1 μm; C, 100 nm; D, E, 10 μm; F–H, 200 nm.
Figure 10.
Figure 10.
Late-onset axonal degeneration in the spinal cord of FA2H−/− mice. A–F, The spinal cord white matter of 18-month-old mice features scattered degenerated myelin sheaths characterized by splitting of myelin lamellae (arrows in B and E), degenerated axons that often display accumulations of fibrillary material (circle in B, black asterisk in C) or collapsed axon cylinders (E, arrows), and microcystic spaces (B, white arrow in C, black asterisk in D and F; compare with controls in A; all photos taken close to the anterior horn). These microcystic spaces are sometimes surrounded by remnants of myelin sheaths (black asterisk in D), indicating that they represent leftovers of degenerated myelinated axons. Care was taken to document these pathologic changes only in the vicinity of well preserved myelin sheaths as an internal control for adequate fixation. F, “Microcysts” appear ultrastructurally as empty gaps without a discernable wall structure. Scale bars: A, 20 μm; B, C, 10 μm; D, E, 0.5 μm; F, 210 μm.
Figure 11.
Figure 11.
Late-onset axonal degeneration in sciatic nerves of FA2H−/− mice. Photomicrographs A and B show cross sections of the sciatic nerve of 5-month-old FA2H+/− (A) and FA2H−/− (B) mice, which were morphologically indistinguishable. Specifically, no evidence was found for alterations of the myelin sheaths; also unspecific signs for peripheral nerve damage such as macrophage invasion were absent. Sciatic nerves of late-adult FA2H−/− mice are characterized by a loss of stainability of myelin sheaths by toluidine blue (compare D with C) and, similar to the phenotype in the spinal cord, splitting of myelin lamellae into concentric rings (white arrows). Also, “empty” myelin sheaths as leftovers of preceding axon degeneration within the myelin sheaths (black arrows) are readily visible. Scale bars, 5 μm.

References

    1. Alderson NL, Rembiesa BM, Walla MD, Bielawska A, Bielawski J, Hama H. The human FA2H gene encodes a fatty acid 2-hydroxylase. J Biol Chem. 2004;279:48562–48568. - PubMed
    1. Alderson NL, Maldonado EN, Kern MJ, Bhat NR, Hama H. FA2H-dependent fatty acid 2-hydroxylation in postnatal mouse brain. J Lipid Res. 2006;47:2772–2780. - PubMed
    1. Altevogt BM, Kleopa KA, Postma FR, Scherer SS, Paul DL. Connexin29 is uniquely distributed within myelinating glial cells of the central and peripheral nervous systems. J Neurosci. 2002;22:6458–6470. - PMC - PubMed
    1. Baumann N, Pham-Dinh D. Biology of oligodendrocyte and myelin in the mammalian central nervous system. Physiol Rev. 2001;81:871–927. - PubMed
    1. Bligh EG, Dyer WJ. A rapid method of total lipid extraction and purification. Can J Biochem Physiol. 1959;37:911–917. - PubMed

Publication types

MeSH terms