. 2008 Sep 24;28(39):9790-6.
doi: 10.1523/JNEUROSCI.1465-08.2008.

Function and structure of the right inferior frontal cortex predict individual differences in response inhibition: a model-based approach

Affiliations

Function and structure of the right inferior frontal cortex predict individual differences in response inhibition: a model-based approach

Birte U Forstmann et al. J Neurosci. .

Abstract

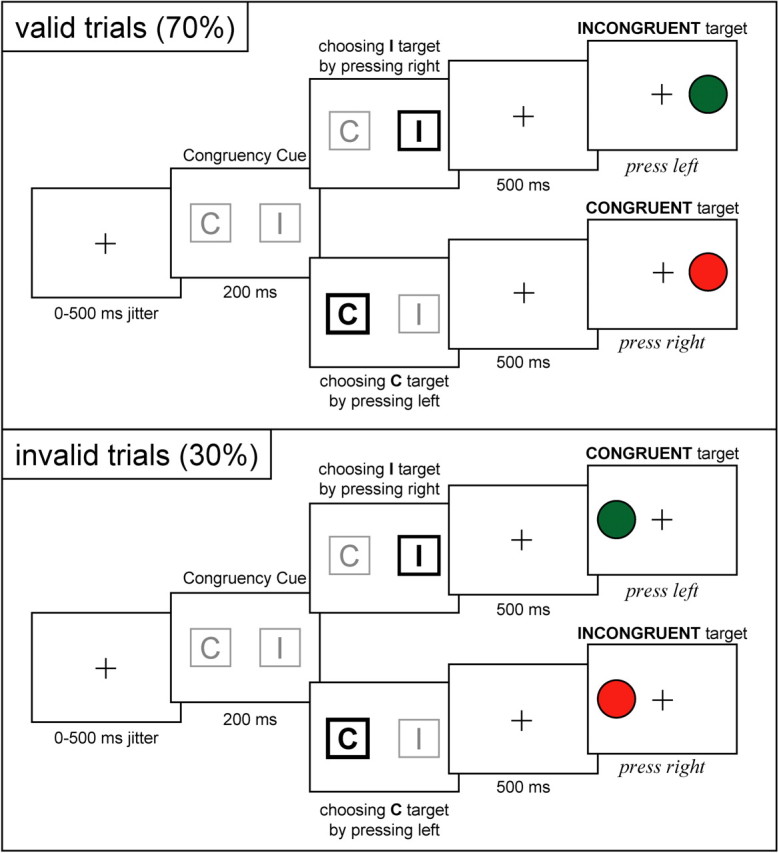
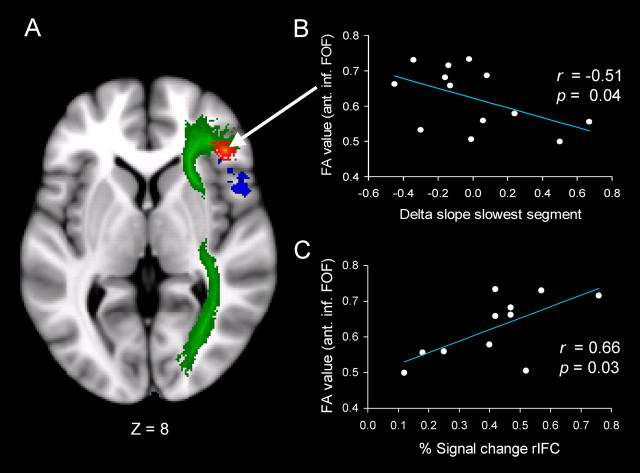
The ability to suppress one's impulses and actions constitutes a fundamental mechanism of cognitive control, thought to be subserved by the right inferior frontal cortex (rIFC). The neural bases of more selective inhibitory control when selecting between two actions have thus far remained articulated with less precision. Selective inhibition can be explored in detail by extracting parameters from response time (RT) distributions as derived from performance in the Simon task. Individual differences in RT distribution parameters not only can be used to probe the efficiency and temporal dynamics of selective response inhibition, but also allow a more detailed analysis of functional neuroimaging data. Such model-based analyses, which capitalize on individual differences, have demonstrated that selective response inhibition is subserved by the rIFC. The aim of the present study was to specify the relationship between model parameters of response inhibition and their functional and structural underpinnings in the brain. Functional magnetic resonance imaging (fMRI) data were obtained from healthy participants while performing a Simon task in which irrelevant information can activate incorrect responses that should be selectively inhibited in favor of selecting the correct response. In addition, structural data on the density of coherency of white matter tracts were obtained using diffusion tensor imaging (DTI). The analyses aimed at quantifying the extent to which RT distribution measures of response inhibition are associated with individual differences in both rIFC function and structure. The results revealed a strong correlation between the model parameters and both fMRI and DTI characteristics of the rIFC. In general, our results reveal that individual differences in inhibition are accompanied by differences in both brain function and structure.


Figures

Figure 1.
Figure 1.
Schematic drawing of the modified Simon task. Each trial started with the presentation of a congruency cue. In the choice condition, participants indicated their preference for receiving a congruent or incongruent target stimulus by selecting either C (congruent) or I (incongruent) with the middle finger or the index finger of the left hand. In the no-choice condition (data not shown here), the congruency cue either conveyed C or I information. The target matched the cue in 70% of the trials (valid trials; top), whereas in 30% of the trials, target congruence did not match the cue (invalid trials; bottom). The target stimuli consisted of green and red circles that were associated with a left and right button press, respectively, with the index or middle fingers of the right hand. In congruent trials, responses were spatially compatible with the location of the target stimulus (e.g., left green circle leads to an index finger response), whereas in incongruent targets, participants' responses were spatially incompatible with the location of the stimulus (e.g., left red circle leads to a middle finger response).
Figure 2.
Figure 2.
Selective response inhibition covariate analysis with individual parameters derived from 14 participants for each segment of the delta plot (depicted in red). Top, The delta slopes separated in fast and slow segments for invalidly cued trials. Middle, Pearson correlations (two-tailed) between the percentage of signal changes (y-axis) derived from the rIFC and the demeaned delta slopes (x-axis) for each segment of the delta plot. Bottom, The averaged activation across 14 participants rendered onto a template brain (z > 2.3, p < 0.05, whole-brain corrected) of the covariance analysis with the two segments of the delta plot. The only significant prefrontal activation is obtained for the slowest segment of the delta plot in the rIFC (Brodmann's area 44; x = 50, y = 26, z = 8). Coordinates are given in MNI space.
Figure 3.
Figure 3.
Function and structure of the rIFC. BOLD data were transformed on the basis of a nonlinear transformation from MNI to tract-based space (the transformation used in DTI analysis) to allow comparison of DTI (red) and fMRI (blue) results (see also Materials and Methods). A, Axial view. Inferior FOF is displayed in green and derived from the Johns Hopkins University White-Matter Tractography Atlas implemented in FSL (FMRIB's Software Library, www.fmrib.ox.ac.uk/fsl; Version 4.0). B, Pearson correlation (one-tailed) between FA values derived from the anterior part of the FOF and demeaned slope values derived from the delta plot of the slowest segment for invalidly cued trials. C, Pearson correlation (two-tailed) between FA values from the anterior part of the inferior FOF and percentage BOLD signal change derived from the rIFC.

References

    1. Aron AR, Poldrack RA. Cortical and subcortical contributions to Stop signal response inhibition: role of the subthalamic nucleus. J Neurosci. 2006;26:2424–2433. - PMC - PubMed
    1. Aron AR, Behrens TE, Smith S, Frank MJ, Poldrack RA. Triangulating a cognitive control network using diffusion-weighted magnetic resonance imaging (MRI) and functional MRI. J Neurosci. 2007;27:3743–3752. - PMC - PubMed
    1. Beckmann CF, Jenkinson M, Smith SM. General multilevel linear modeling for group analysis in fMRI. Neuroimage. 2003;20:1052–1063. - PubMed
    1. Burle B, Possamaï CA, Vidal F, Bonnet M, Hasbroucq T. Executive control in the Simon effect: an electromyographic and distributional analysis. Psychol Res. 2002;66:324–336. - PubMed
    1. Daw ND, O'Doherty JP, Dayan P, Seymour B, Dolan RJ. Cortical substrates for exploratory decisions in humans. Nature. 2006;441:876–879. - PMC - PubMed

Publication types

LinkOut - more resources