. 2009 Jan 1;113(1):108-16.
doi: 10.1182/blood-2008-06-160937. Epub 2008 Sep 24.

Epstein-Barr virus latent membrane protein 2A exploits Notch1 to alter B-cell identity in vivo

Affiliations

Epstein-Barr virus latent membrane protein 2A exploits Notch1 to alter B-cell identity in vivo

Leah J Anderson et al. Blood. .

Abstract

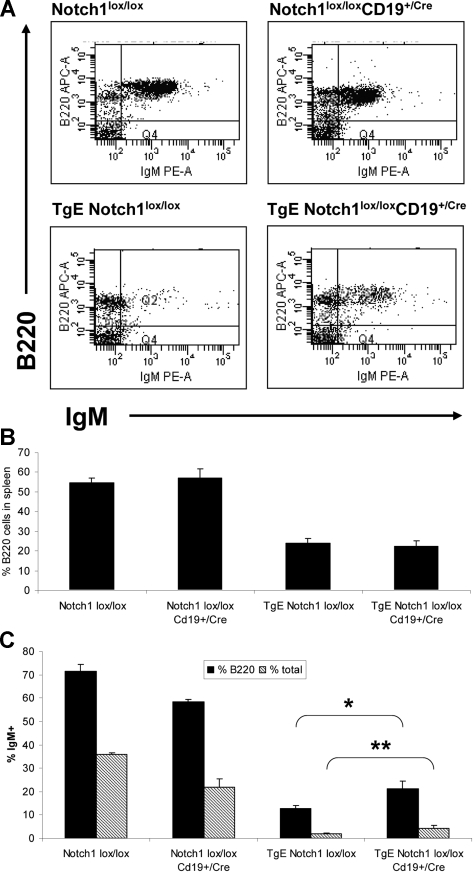
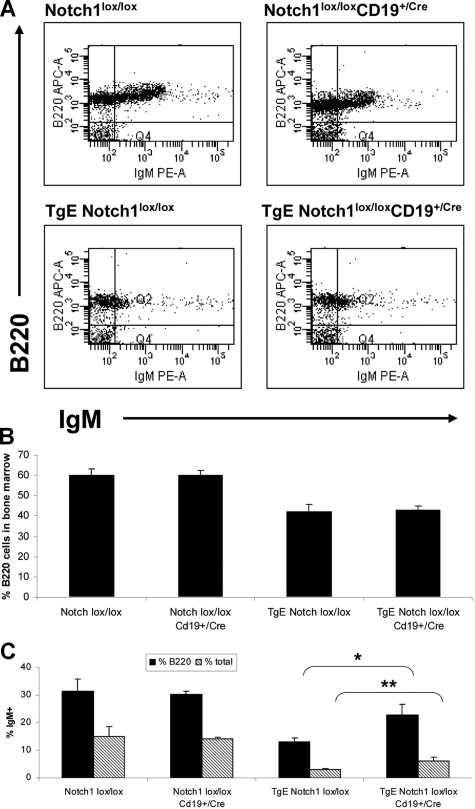
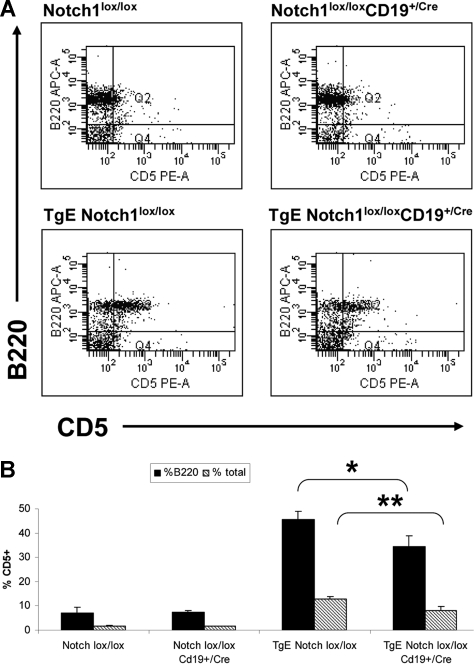
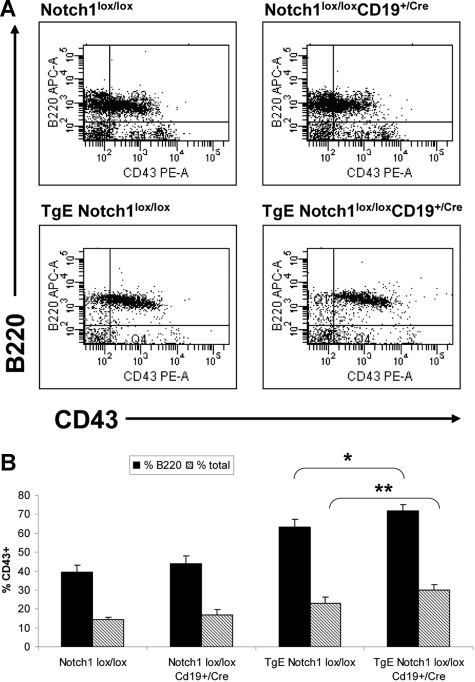
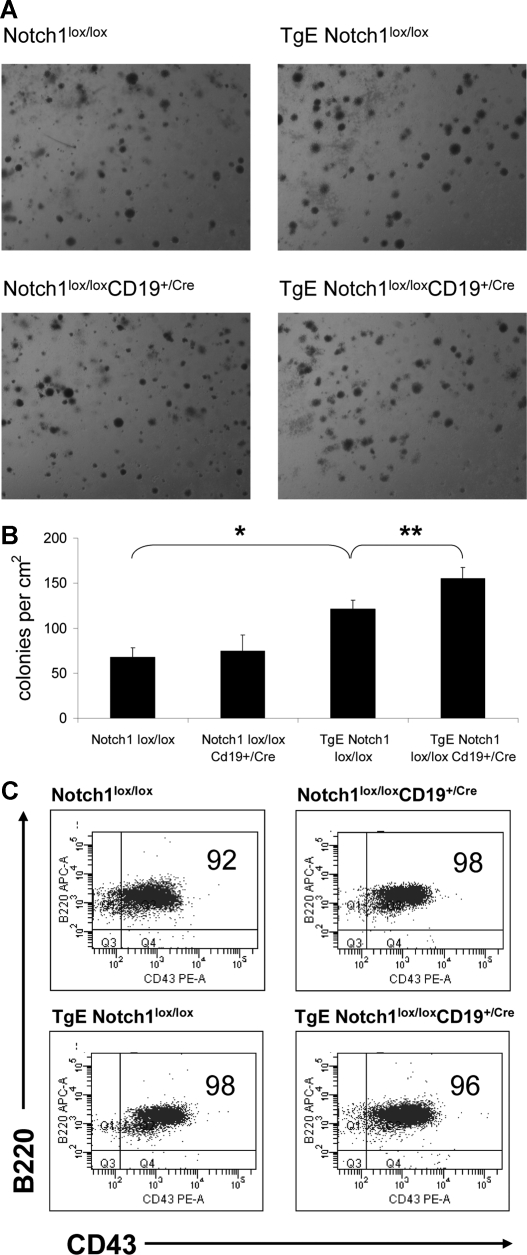
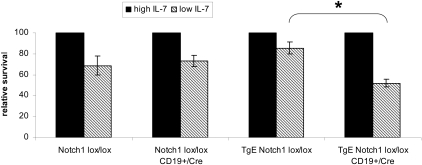
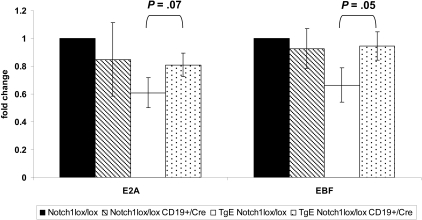
Expression of latent membrane protein 2 (LMP2A) during B-cell development leads to global alterations in gene transcription similar to those seen in Hodgkin Reed-Sternberg cells of Hodgkin lymphoma (HL). Along with the consistent detection of LMP2A in Epstein-Barr virus-associated HL, this implicates a role for LMP2A in the pathogenesis of HL. We have shown that LMP2A constitutively activates the Notch1 pathway to autoregulate the LMP2A promoter. To determine whether constitutive activation of the Notch pathway is important for LMP2A-mediated alterations in B-cell development in vivo, TgE-LMP2A-transgenic mice were intercrossed with mice expressing loxP-flanked Notch1 genes and Cre recombinase. B cells from TgE Notch1(lox/lox)-CD19(+/Cre) mice have an increase in immunoglobulin M and CD43 and a decrease in CD5 expression in the bone marrow compared with TgE Notch1(lox/lox) mice, indicating the LMP2A signal for developmental aberrations is impaired in the absence of Notch1. Real-time reverse-transcribed polymerase chain reaction analysis reveals that LMP2A requires the Notch1 pathway to alter levels of B cell-specific transcription factors, E2A and EBF. Interestingly, Notch1 appears to be important for LMP2A-mediated survival in low interleukin-7. We propose that LMP2A and the Notch1 pathway may cooperate to induce the alterations in B-cell identity seen in Hodgkin Reed-Sternberg cells.


Figures

Figure 1
Figure 1
Loss of Notch1 expression in TgE mice results in increased IgM+ B cells in the spleen. (A) Total cells isolated from the spleen of each indicated genotype were stained with B220 and IgM fluorochrome-conjugated antibodies and analyzed by flow cytometry. Live cell populations, designated by forward and side scatter properties, were plotted with IgM and B220, and a representative plot is shown for each genotype. CD19-Cre–mediated deletion has been demonstrated previously to have an efficiency of approximately 80% in the bone marrow and 90% to 95% in the spleen. (B) The average percent of B cells based on B220 staining for each genotype is shown plus or minus SE. (C) The average percentage of B cells that have IgM on the cell surface (%B220) as well as the percentage of total spleen cells that are IgM+ (% total) for each genotype is shown plus or minus SE. The percentage of B220 cells expressing IgM (%B220) is calculated to account for differences in total B cells between the genotypes. Results from 4 independent experiments are shown. *P = .04, **P = .05 by t test. Notch1lox/lox, n = 5 mice; Notch1lox/lox CD19+/Cre, n = 4; TgE Notch1lox/lox, n = 7; TgE Notch1lox/lox CD19+/Cre, n = 8.
Figure 2
Figure 2
Loss of Notch1 expression in TgE mice results in increased IgM+ B cells in the bone marrow. Total cells isolated from the bone marrow of each indicated genotype were stained with B220 and IgM-conjugated antibodies and analyzed by flow cytometry. Live cell populations, designated by forward and side scatter properties, were plotted with IgM and B220, and a representative plot for each genotype is shown (A). (B) The average percentage of B220+ cells in the bone marrow for each genotype is indicated plus or minus SE. (C) The average percentage of B cells expressing IgM in the bone marrow from 4 independent experiments is shown. Data are represented as the percentage of B220+ cells that express IgM (%B220) as well as the percentage of total bone marrow that is B220+IgM+ (percentage of total). *P = .04, **P = .03 by t test. Notch1lox/lox, n = 4 mice; Notch1lox/lox CD19+/Cre, n = 4; TgE Notch1lox/lox, n = 4; TgE Notch1lox/lox CD19+/Cre, n = 6.
Figure 3
Figure 3
The signal strength of LMP2A is decreased in the bone marrow of TgE Notch1lox/loxCD19+/Cre mice. Total cells isolated from the bone marrow of each indicated genotype were stained with B220 and CD5 fluorochrome-conjugated antibodies and analyzed by flow cytometry. Live cell populations, designated by forward and side scatter properties, were gated to examine CD5 expression and a representative plot is shown for each genotype (A). (B) The average results from 4 independent experiments are shown plus or minus SE. Populations are represented as the percentage of total bone marrow that is CD5 positive (percentage of total) as well as the percentage of B cells that are CD5 positive (%B220). *P = .03, **P = .02 by t test. Notch1lox/lox, n = 5 mice; Notch1lox/lox CD19+/Cre, n = 5; TgE Notch1lox/lox, n = 7; TgE Notch1lox/lox CD19+/Cre, n = 9.
Figure 4
Figure 4
CD43+ B cells accumulate in the bone marrow of TgE Notch1lox/lox CD19+/Cre mice. Total cells isolated from the bone marrow of each indicated genotype were stained with B220 and CD43 fluorochrome-conjugated antibodies and analyzed by flow cytometry. Live cell populations, designated by forward and side scatter properties, were gated and B220 and CD43 expression was examined. A representative dot plot for each genotype is shown (A). (B) The average percentage of B cells in the bone marrow that express CD43 is shown plus or minus SE. Populations are represented as the percentage of total bone marrow that is CD43+ (% total) as well as the percentage of B cells that are CD43+ (%B220). *P = .05, **P = .04 by t test. Notch1lox/lox, n = 5 mice; Notch1lox/lox CD19+/Cre, n = 5; TgE Notch1lox/lox, n = 8; TgE Notch1lox/lox CD19+/Cre, n = 11.
Figure 5
Figure 5
Bone marrow from TgE Notch1lox/lox CD19+/Cre mice forms more colonies in methylcellulose than TgE Notch1lox/lox mice. Bone marrow cells were plated in methylcellulose with IL-7. After 7 days, the numbers of colonies in 1 cm2 were counted in triplicate wells for each genotype. (A) Representative images of colonies formed from bone marrow cells for each genotype. Methylcellulose cultures were viewed with a Nikon SMZ1000 stereomicroscope with an HR Plan Apo 1× WD54 objective (Nikon Instruments, Melville, NY). Images were acquired using a Polaroid Digital Camera model PDM02 and DMC le version V1.25 software (Polaroid, Concord MA) and processed using Adobe Photoshop version 7.0 software (Adobe Systems, San Jose, CA). (B) The number of colonies in 1 cm2 of the culture dish was counted in triplicate for each genotype and the average number of colonies for 3 independent experiments is shown plus or minus SE. *P = .001, **P = .03 by t test. (C) Cells from methylcellulose cultures were stained with B220 and CD43 antibodies and analyzed by flow cytometry. The live cell population, designated by forward and side scatter properties, was gated to examine expression of B220 and CD43. A representative plot for each genotype is shown with percentages for each population. Typically, the majority of cells are B220+CD43+ B cells.
Figure 6
Figure 6
Bone marrow B cells TgE Notchlox/lox CD19+/Cre mice have a decreased survival capacity in low IL-7. Equal numbers of B220+ cells harvested from methylcellulose cultures were plated in either high IL-7 or low IL-7. At 48 hours, cells were analyzed by flow cytometry to determine the cell recovery. The percentage of cells in the live cell gate, based on forward and side scatter properties, was recorded and graphed as relative survival compared with high IL-7 for each genotype. We have demonstrated previously that relative survival inversely correlates with apoptosis as measured by annexin V binding. Results are the average of 3 independent experiments after 48 hours plus or minus SE. *P = .002 by t test. Notch1lox/lox, n = 4 mice; Notch1lox/lox CD19+/Cre, n = 3; TgE Notch1lox/lox, n = 5; TgE Notch1lox/lox CD19+/Cre, n = 6.
Figure 7
Figure 7
Notch1 expression is required for LMP2A to alter mRNA levels of B cell–specific transcription factors in TgE mice. Real-time RT-PCR gene expression analysis was performed using total RNA isolated from B220+ bone marrow B cells harvested from methylcellulose cultures of each genotype. Primers specific for E2A and EBF were used along with GAPDH as a control for RNA levels. Fold change in gene expression was calculated using the ΔΔCt method, and fold change is shown relative to wild-type (Notch1lox/lox) mice. Results are the average of at least 3 independent experiments plus or minus SE. Notch1lox/lox, n = 6 mice; Notch1lox/lox CD19+/Cre, n = 4; TgE Notch1lox/lox, n = 3; TgE Notch1lox/lox CD19+/Cre, n = 6.

References

    1. Rickinson AB, Kieff E. Epstein-Barr Virus. Philadelphia, PA: Lippincott-Raven Publishers; 2007. pp. 2397–2446.
    1. Caldwell RG, Wilson JB, Anderson SJ, Longnecker R. Epstein-Barr virus LMP2A drives B-cell development and survival in the absence of normal B cell receptor signals. Immunity. 1998;9:405–411. - PubMed
    1. Hardy RR, Carmack CE, Shinton SA, Kemp JD, Hayakawa K. Resolution and characterization of pro-B and pre-pro-B cell stages in normal mouse bone marrow. J Exp Med. 1991;173:1213–1225. - PMC - PubMed
    1. Caldwell RG, Brown RC, Longnecker R. Epstein-Barr virus LMP2A-induced B-cell survival in two unique classes of EmuLMP2A transgenic mice. J Virol. 2000;74:1101–1113. - PMC - PubMed
    1. Casola S, Otipoby KL, Alimzhanov M, et al. B cell receptor signal strength determines B cell fate. Nat Immunol. 2004;5:317–327. - PubMed

Publication types

MeSH terms