Review
. 2008 Dec;29(7):898-938.
doi: 10.1210/er.2008-0019. Epub 2008 Sep 24.

Cellular and molecular basis of deiodinase-regulated thyroid hormone signaling

Affiliations
Review

Cellular and molecular basis of deiodinase-regulated thyroid hormone signaling

Balázs Gereben et al. Endocr Rev. 2008 Dec.

Abstract

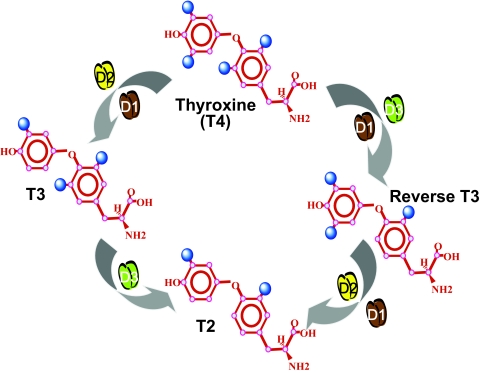
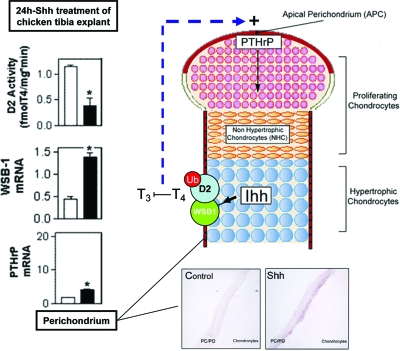
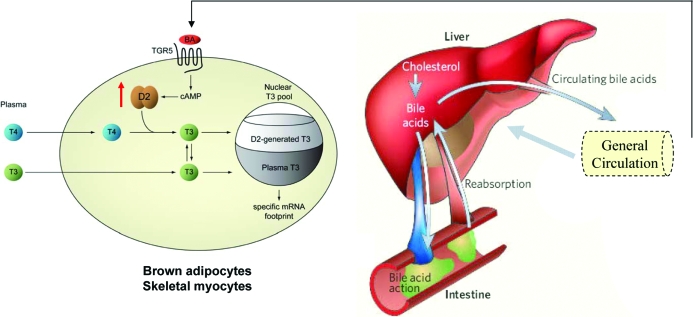
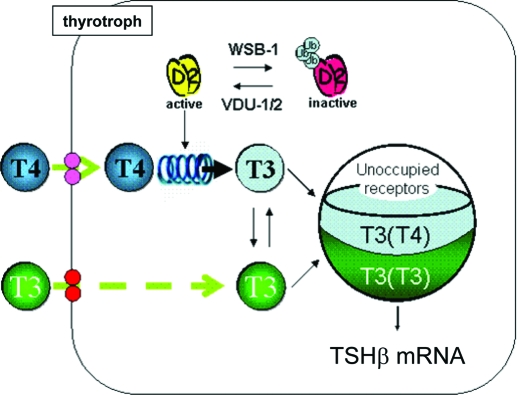
The iodothyronine deiodinases initiate or terminate thyroid hormone action and therefore are critical for the biological effects mediated by thyroid hormone. Over the years, research has focused on their role in preserving serum levels of the biologically active molecule T(3) during iodine deficiency. More recently, a fascinating new role of these enzymes has been unveiled. The activating deiodinase (D2) and the inactivating deiodinase (D3) can locally increase or decrease thyroid hormone signaling in a tissue- and temporal-specific fashion, independent of changes in thyroid hormone serum concentrations. This mechanism is particularly relevant because deiodinase expression can be modulated by a wide variety of endogenous signaling molecules such as sonic hedgehog, nuclear factor-kappaB, growth factors, bile acids, hypoxia-inducible factor-1alpha, as well as a growing number of xenobiotic substances. In light of these findings, it seems clear that deiodinases play a much broader role than once thought, with great ramifications for the control of thyroid hormone signaling during vertebrate development and metamorphosis, as well as injury response, tissue repair, hypothalamic function, and energy homeostasis in adults.


Figures

Figure 1
Figure 1
Schematic of deiodinase-mediated metabolism of the major iodothyronines. [Figure was modified with permission from Bianco and Kim: J Clin Invest 116:2571–2579, 2006 (33). ©American Society for Clinical Investigation.]
Figure 2
Figure 2
Subcellular localization of deiodinases by immunofluorescence. HEK-293 cells were transiently transfected with FLAG-tagged D1, D2, or D3 (left). D1 (green) is located in the plasma membrane region and does not colocalize with the ER marker GRP78/BIP (red), in contrast to D2 (green), which is located in the ER. D3 (green) was colocalized to the plasma membrane with Na/K ATPase (red). Immunofluorescence staining of endogenously expressed deiodinases is shown in the right panel. D1 in porcine thyrocytes is found in the plasma membrane (image kindly provided by Dr. Peter Arvan, Ann Arbor, MI), whereas endogenously expressed D2 in MSTO-211H cells colocalized with GRP78/BIP in the ER. Endogenous D3 protein was detected in the plasma membrane of NCLP-6E cells. Scale bar, 10 μm. [Reprinted with permission from Baqui et al.: Endocrinology 141:4309–4312, 2000 (48), ©The Endocrine Society. Reproduced with permission of the Company of Biologists from Prabakaran et al.: J Cell Sci 112:1247–1256, 1999 (47); Curcio et al.: J Biol Chem 276:30183–30187, 2001 (49), ©ASBMB, Inc.; and Baqui et al.: J Biol Chem 278:1206–1211, 2003 (50), ©ASBMB, Inc.]
Figure 3
Figure 3
Deiodinases are dimers. FRET measures the transfer of energy from an excited CFP-tagged molecule to a YFP-tagged acceptor molecule in close proximity. The FRET between D2-CFP and D2-YFP fusion proteins in transfected cells is shown. The location of the CFP and YFP chromophores relative to the D2 protein is indicated by N (amino) or C (carboxyl), respectively, and results are expressed as a percentage of the FRET of a positive control YFP-CFP fusion protein indicated by a plus symbol. CFP + YFP is a negative control for both proteins expressed alone. Notably, D2 with an N-terminal fusion of CFP has no FRET with D2 a C-terminal fusion of YFP, whereas FRET is observed between an N-terminal fusion of CFP to D2 and a N-terminal fusion of YFP to D2, or between a C-terminal fusion of CFP to D2 and C-terminal fusion of YFP to D2 (left panel, last 3 columns). For the bioluminescence resonance energy transfer studies (right panel), YFP fused to the N or C terminus of D2 and Renilla luciferase fused to the C terminus of D2 were expressed in transfected cells. Luminesence produced by the luciferase molecule can then excite a YFP molecule in close proximity, and the resulting YFP emission is measured. YFP, Yellow fluorescent protein; CFP, cyan fluorescent protein. [Reprinted with permission from Sagar et al.: Mol Cell Biol 27:4774–4783, 2007 (44). ©The American Society for Microbiology.]
Figure 4
Figure 4
Globular interfaces mediate D2 dimerization and are critical for catalytic activity. A, Two orthogonal views of the modeled D2 dimer on the template of the crystal structure of human TRX dimer. At the top, the twofold axis is vertical, and at the bottom, it is perpendicular to the figure. Secondary structures are colored. The putative structure of the iduronidase-like active site insertion has been modeled as a ββ secondary structure (βd1 and βd2) lying between β2 and αB. βd1 is green/light purple, βd2 is dark purple, and, at the bottom of the dimer, the two symmetrical small βT in pink are the counterparts of the canonical TRX pairing. B, 3D model of the D2–D2 homodimer. N′ter and Cter indicate the N terminus of the TRX fold head domain and the C terminus of D2, respectively. A single large cavity is created upon D2 dimerization at the level of the active site (Sec133). C, Visualization of the Russian-doll-shaped electrostatic field around the D2 dimer (the −1.8-kT/e gradient limit is red and the +1.8-kT/e gradient limit is blue). [Reprinted with permission from Sagar et al.: Mol Cell Biol 27:4774–4783, 2007 (44). ©The American Society for Microbiology.]
Figure 5
Figure 5
Schematic of selenoprotein synthesis. As reviewed in Section II.B, in order for UGA to encode for selenocysteine insertion and not translational termination, the selenoprotein mRNAs require a downstream stem loop structure, the SECIS. The SECIS element binds SBP-2, which in turn interacts with a selenocysteine-specific elongation factor, EFsec. EFsec also binds the selenocysteine tRNA (Sec-tRNASec) and promotes selenocysteine incorporation in the elongating protein by the ribosome at the UGA codon. An additional SECIS binding protein, L30, can displace SBP-2 and anchor the loaded SECIS complex to the ribosome. The role of SECp43 remains to be defined; however this protein has been shown either to interact directly with or facilitate the interaction between many components needed for selenoprotein synthesis. The recently defined mammalian pathway of selenocysteine synthesis is also illustrated in the lower part of the figure, with the tRNASec initially being misacylated with serine, which is then phosphorylated by phosphoseryl-tRNA[Ser]Sec kinase (PSTK). SLA then dephosphorylates this serine, which is then followed by acceptance of active selenium generated via SPS-2.
Figure 6
Figure 6
The D2 ubiquitination machinery: composition of the ECSWSB1 catalytic core complex. Modeling of the Ub conjugating Cul5–Rbx1—Elongin C–Elongin B–von Hippel-Lindau complex associated with the SOCS box of WSB1 while the WSB1 propeller binds D2 is shown. Rbx1 interacts with the E2-enzyme Ubc7, which in turn associates with the ER membrane via Cue1, an ER membrane-anchored protein that is required for Ubc7 function. It is currently unknown whether only the D2 subunit not bound by WSB1 is undergoing ubiquitination or whether only this subunit is catalytically active. Ub is shown docked to Ubc7. T4 substrate is shown in white at the active site of the D2 dimer. [Reprinted with permission from Dentice et al.: Nat Cell Biol 7:698–705, 2005 (31).]
Figure 7
Figure 7
Role of D2 and D3 in thyroid hormone signaling. T4 and T3 are represented by blue and green circles, whereas D2 and D3 homodimers are represented by brown and yellow ovals. A, D3 catalyzes the conversion of plasma and cellular T4 and T3 to the inactive metabolites rT3 and T2, respectively, decreasing the nuclear pool of T3 available to occupy TRs. B, In D2-expressing cells, the nuclear pool of T3 available to the TRs originates from both plasma T3 and T3 generated via D2. [Modified with permission from Bianco et al.: Endocrinology 148:3077–3079, 2007 (445). ©The Endocrine Society.]
Figure 8
Figure 8
A, Structure and nomenclature of thyronamines. B, Schematic diagram of potential thyronamine deiodination pathways. [Reprinted with permission from Piehl et al.: Endocrinology 149:3037–3045, 2008 (203). ©The Endocrine Society.]
Figure 9
Figure 9
D2 activity is regulated by hedgehog signaling via WSB1 in the developing chicken tibial growth plate. In the graphs, white bars indicate treatment with vehicle, whereas black bars equal treatment with Shh (left). In situ hybridizations show WSB1 expression levels in perichondrium/periosteum (PC/PO). Indian hedgehog increases WSB1 expression, in turn increasing the ubiquitination and inactivation of D2. Less D2 results in a block in T3 to T4 production and local hypothyroidism at the apical perichondrium, causing an increase in PTHrP production, resulting in chondrocyte proliferation. [Reprinted in part with permission from Dentice et al.: Nat Cell Biol 7:698–705, 2005 (31).]
Figure 10
Figure 10
D3 expression in normal skin and basal cell carcinoma (BCC). D3 expression in normal skin during the hair follicle cycle is time- and cell type-specific and overlaps Shh targets. A, D3 staining in the mouse skin at different stages of the hair follicle cycle demonstrated that during anagen (postnatal day 5), D3 was highly expressed in the hair follicle matrix and absent from the dermal papilla. In telogen (prenatal day 21), D3 expression was almost absent from the hair follicles. B, D3 immunostaining of normal skin and a representative BCC sample. [Reprinted with permission from Dentice et al.: Proc Natl Acad Sci USA 104:14466–14471, 2007 (32).]
Figure 11
Figure 11
Bile acids stimulate D2 expression in brown adipocytes. Schematic representation of the bile acid-TGR5–D2 pathway in brown adipocytes. Bile acids in the general circulation derived from the enterohepatic circulation potentially may stimulate TGR5 increasing cAMP, and thus leading to an increase in D2 expression in tissues where both proteins are coexpressed, e.g., BAT and skeletal muscle. This pathway has been shown to increase energy expenditure and protect against diet-induced obesity in mice (171). [Reproduced in part with permission from Baxter and Webb: Nature 439:402–403, 2006 (446).]
Figure 12
Figure 12
Role of D2 in TSH feedback. In the thyrotroph, the TSH gene is subject to negative feedback by T3 in the nucleus derived from two distinct sources: plasma T3, illustrated as T3(T3); and plasma T4, which is then converted to T3 intracellularly via the D2 pathway, represented as T3(T4). This schematic includes the plasma membrane, which contains thyroid hormone transporters (indicated by the pink and red circles); the cytoplasm, containing the enzymes involved in thyroid hormone metabolism; and the nucleus, containing the TRs. D2 is represented in its active form (yellow) and inactive form (red). Transition between active and inactive D2 is via ubiquitination and deubiquitination, which are catalyzed by WSB1 and VDU1/VDU2, respectively. As a result of ubiquitination, D2-mediated generation of T3(T4) occurs at variable rates, decreasing as serum T4 concentration increases. Ultimately, these processes determine nuclear TR saturation, with only a minor fraction of the TRs being unoccupied under normal conditions. [Figure modified with permission from Bianco and Kim: J Clin Invest 116:2571–2579, 2006 (33). ©American Society for Clinical Investigation.]
Figure 13
Figure 13
Thyrotrophin triggers photoperiodic response and long-day photoinduced seasonal breeding in the Japanese quail (Coturnix japonica). Chronic intracerebroventricular infusion of TSH increases D2 expression of the mediobasal hypothalamus. [Reprinted with permission from Nakao et al.: Nature 452:317–322, 2008 (324).]
Figure 14
Figure 14
Local and global changes in thyroid hormone signaling during nonthyroidal illness. A, In euthyroid individuals, thyroid hormone signaling in peripheral tissues is determined by the available nuclear T3 pool that is maintained within normal levels through the regulation of glandular secretion and the conversion of T4 into T3 by D1- and D2-containing tissues. B, During illness and the low T3 syndrome, the nuclear T3 pool is decreased due to decreased glandular secretion, decreased conversion of T4 into T3, and the inactivation of T4 and T3 by reactivated D3. The red arrows indicate decreased enzyme activity; the word “Secretion” has been hatched and lines dotted to indicate a decrease, and the question mark indicates uncertainty regarding the role played by D2 in illness. In panels A and B, some processes are shown in a simplified manner for the sake of clarity: the smaller circles on the left represent cells expressing D1 and/or D2, whereas T4 inside these cells originates from the plasma; the mRNA footprint indicates the set of genes that are regulated by thyroid hormone. [Modified with permission from Bianco et al.: Endocrinology 148:3077–3079, 2007 (445). ©The Endocrine Society.]
Figure 15
Figure 15
Hindlimb section showing a turpentine-induced abscess in the subcutis. A, Hematoxylin and eosin staining. Note necrosis in the middle of the abscess, surrounded by a large number of granulocytes, lymphocytes, and macrophages. B, D3 immunocytochemistry (ab 676). C, MCT8 immunohistochemistry (ab1306). D, Staining with preabsorbed D3 antiserum. E, D3 preimmune staining. F, Staining with preabsorbed MCT8 antiserum. G, MCT8 preimmune staining. Bar, 500 μm. Note D3 expression found within the inflammation in the abscess. [Reprinted with permission from Boelen et al.: Endocrinology 146:5128–5134, 2005 (371). ©The Endocrine Society.]
Figure 16
Figure 16
Infection up-regulates D2 expression in the mediobasal hypothalamus. Low-power dark-field micrographs from three different rostrocaudal levels of the median eminence (ME) showing the effect of LPS treatment on D2 mRNA expression in the mediobasal hypothalamus. A–C, Controls; D–F, lipopolysaccharide-treated animals. Note: D2 in situ hybridization signal is increased in the tanycytes lining the wall of the third ventricle (III), in the tanycyte processes in the tuberoinfundibular sulci (arrows) and in the external zone of the ME. ARC, Arcuate nucleus. [Reprinted with permission from Fekete et al.: Endocrinology 145:1649–1655, 2004 (177). ©The Endocrine Society.]
Figure 17
Figure 17
Individuals with a mutation in SBP-2 have defects in D2. A, Serum TSH (mU/liter) in affected or unaffected individuals before and during oral administration of incremental doses of l-T4. Patients with a mutation in SBP-2 required greater doses of T4 to suppress TSH. B, Serum TSH (mU/liter) and corresponding serum T3 levels (ng/dl) in affected or unaffected individuals before and during the oral administration of incremental doses of l-T3 for 5 d. TSH suppression was achieved at similar concentration of serum T3 in all four subjects. C, D2 enzymatic activity in fibroblasts from two affected children and six unaffected individuals. Baseline (open symbols) and cAMP-stimulated (filled symbols) D2 activity in unaffected (squares) and affected (circles) individuals. The dashed line indicates the limit of detection of the assay. The mean baseline activity in fibroblasts from affected individuals was reduced to near or below the limit of detection and was not inducible by cAMP. D2 mRNA levels were the same in both affected and unaffected individuals (data not shown). [Reprinted with permission from Dumitrescu et al.: Nat Genet 37:1247–1252, 2005 (80).]

References

    1. Gross J, Pitt-Rivers R 1952 The identification of 3,5, 3′-L-triiodothyronine in human plasma. Lancet 1:439 - PubMed
    1. Braverman LE, Ingbar SH, Sterling K 1970 Conversion of thyroxine (T4) to triiodothyronine (T3) in athyreotic subjects. J Clin Invest 49:855–864 - PMC - PubMed
    1. Wu Y, Koenig RJ 2000 Gene regulation by thyroid hormone. Trends Endocrinol Metab 11:207–211 - PubMed
    1. Yen PM, Ando S, Feng X, Liu Y, Maruvada P, Xia X 2006 Thyroid hormone action at the cellular, genomic and target gene levels. Mol Cell Endocrinol 246:121–127 - PubMed
    1. Bianco AC, Salvatore D, Gereben B, Berry MJ, Larsen PR 2002 Biochemistry, cellular and molecular biology and physiological roles of the iodothyronine selenodeiodinases. Endocr Rev 23:38–89 - PubMed

Publication types