

Opening the climate envelope reveals no macroscale associations with climate in European birds
- PMID: 18815364
- PMCID: PMC2567466
- DOI: 10.1073/pnas.0803506105
Opening the climate envelope reveals no macroscale associations with climate in European birds
Abstract
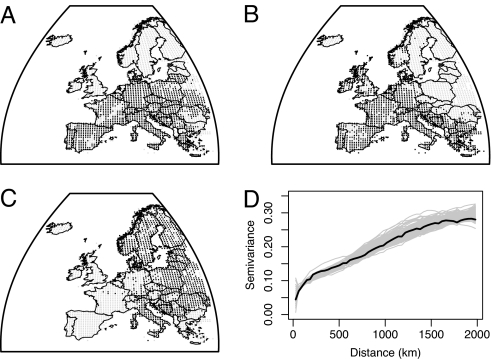
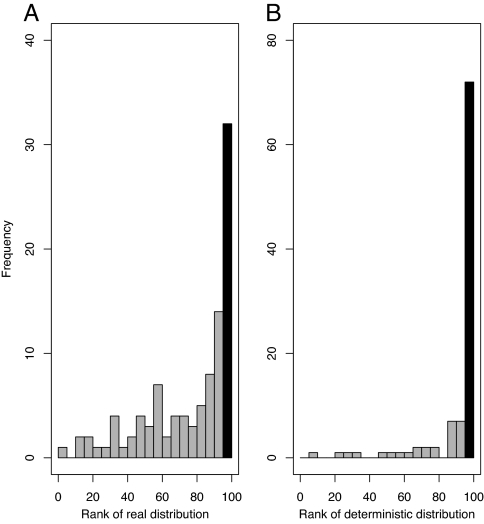
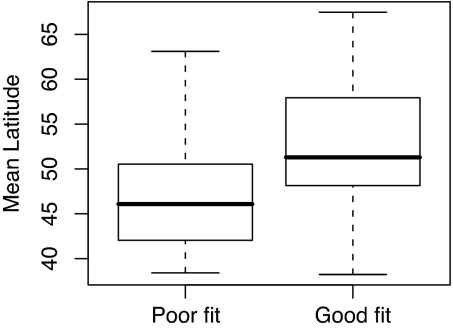
Predicting how species distributions might shift as global climate changes is fundamental to the successful adaptation of conservation policy. An increasing number of studies have responded to this challenge by using climate envelopes, modeling the association between climate variables and species distributions. However, it is difficult to quantify how well species actually match climate. Here, we use null models to show that species-climate associations found by climate envelope methods are no better than chance for 68 of 100 European bird species. In line with predictions, we demonstrate that the species with distribution limits determined by climate have more northerly ranges. We conclude that scientific studies and climate change adaptation policies based on the indiscriminate use of climate envelope methods irrespective of species sensitivity to climate may be misleading and in need of revision.
Conflict of interest statement
The authors declare no conflict of interest.
Figures
Comment in
-
Calculations on the back of a climate envelope: addressing the geography of species distributions.Proc Natl Acad Sci U S A. 2009 Apr 21;106(16):E44; author reply E41-3. doi: 10.1073/pnas.0809891106. Epub 2009 Apr 15. Proc Natl Acad Sci U S A. 2009. PMID: 19369201 Free PMC article. No abstract available.
-
The climate envelope may not be empty.Proc Natl Acad Sci U S A. 2009 Apr 21;106(16):E47; author reply E41-3. doi: 10.1073/pnas.0809722106. Epub 2009 Apr 15. Proc Natl Acad Sci U S A. 2009. PMID: 19369202 Free PMC article. No abstract available.
-
Reopening the climate envelope reveals macroscale associations with climate in European birds.Proc Natl Acad Sci U S A. 2009 Apr 21;106(16):E45-6; author reply E41-3. doi: 10.1073/pnas.0813294106. Epub 2009 Apr 15. Proc Natl Acad Sci U S A. 2009. PMID: 19369203 Free PMC article. No abstract available.
References
-
- Araujo MB, Pearson RG, Thuiller W, Erhard M. Validation of species-climate impact models under climate change. Glob Chang Biol. 2005;11:1504–1513.
-
- Parmesan C, Yohe G. A globally coherent fingerprint of climate change impacts across natural systems. Nature. 2003;421:37–42. - PubMed
-
- Thomas CD, et al. Extinction risk from climate change. Nature. 2004;427:145–148. - PubMed
Publication types
MeSH terms
LinkOut - more resources
Full Text Sources
Other Literature Sources
