

Higher criticism thresholding: Optimal feature selection when useful features are rare and weak
- PMID: 18815365
- PMCID: PMC2553037
- DOI: 10.1073/pnas.0807471105
Higher criticism thresholding: Optimal feature selection when useful features are rare and weak
Abstract
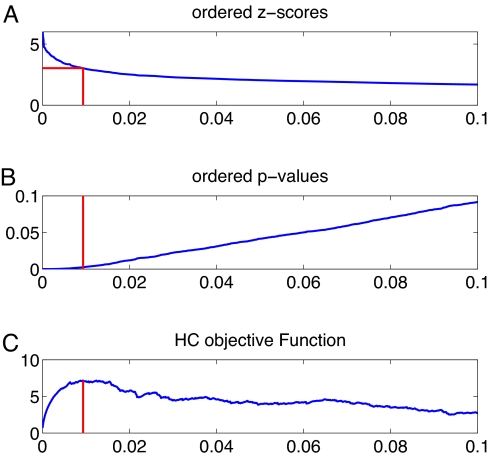
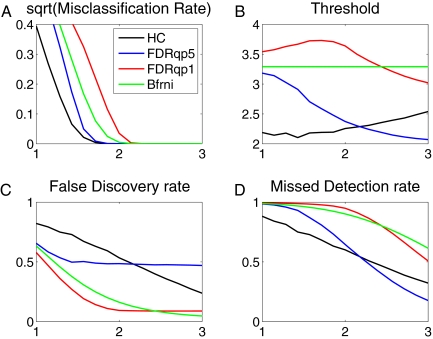
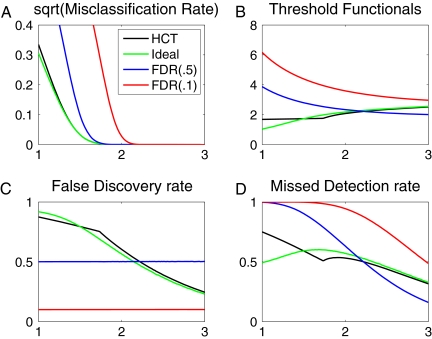
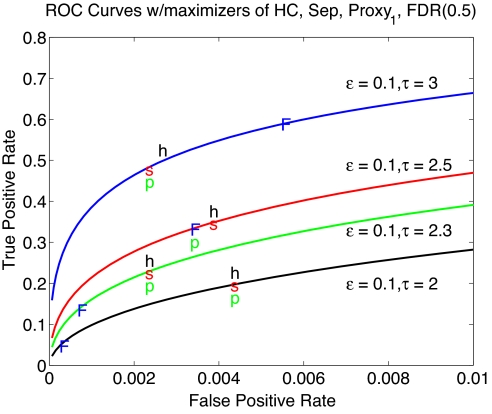
In important application fields today-genomics and proteomics are examples-selecting a small subset of useful features is crucial for success of Linear Classification Analysis. We study feature selection by thresholding of feature Z-scores and introduce a principle of threshold selection, based on the notion of higher criticism (HC). For i = 1, 2, ..., p, let pi(i) denote the two-sided P-value associated with the ith feature Z-score and pi((i)) denote the ith order statistic of the collection of P-values. The HC threshold is the absolute Z-score corresponding to the P-value maximizing the HC objective (i/p - pi((i)))/sqrt{i/p(1-i/p)}. We consider a rare/weak (RW) feature model, where the fraction of useful features is small and the useful features are each too weak to be of much use on their own. HC thresholding (HCT) has interesting behavior in this setting, with an intimate link between maximizing the HC objective and minimizing the error rate of the designed classifier, and very different behavior from popular threshold selection procedures such as false discovery rate thresholding (FDRT). In the most challenging RW settings, HCT uses an unconventionally low threshold; this keeps the missed-feature detection rate under better control than FDRT and yields a classifier with improved misclassification performance. Replacing cross-validated threshold selection in the popular Shrunken Centroid classifier with the computationally less expensive and simpler HCT reduces the variance of the selected threshold and the error rate of the constructed classifier. Results on standard real datasets and in asymptotic theory confirm the advantages of HCT.
Conflict of interest statement
The authors declare no conflict of interest.
Figures
References
-
- Anderson TW. An Introduction to Multivariate Statistical Analysis. 3rd Ed. New York: Wiley; 2003.
-
- Bickel P, Levina E. Some theory of Fisher's linear discriminant function, ‘naive Bayes’, and some alternatives when there are many more variables than observations. Bernoulli. 2004;10:989–1010.
-
- Donoho D, Johnstone I. Minimax risk over lp-balls for lq-error. Probab Theory Relat Fields. 1994;2:277–303.
-
- Donoho D, Johnstone I, Hoch JC, Stern AS. Maximum entropy and the nearly black object. J R Stat Soc B. 1992;54:41–81.
Publication types
MeSH terms
LinkOut - more resources
Full Text Sources
Other Literature Sources
Research Materials
Miscellaneous
