Review
. 2008 Nov;108(11):4628-69.
doi: 10.1021/cr0782574. Epub 2008 Sep 25.

Calcium orthophosphates: crystallization and dissolution

Affiliations
Review

Calcium orthophosphates: crystallization and dissolution

Lijun Wang et al. Chem Rev. 2008 Nov.
No abstract available


Figures

Figure 1
Figure 1
Solubility isotherms of calcium phosphate phases at 37 °C and I = 0.1 M. Reprinted with permission from ref . Copyright 1992 International & American Association for Dental Research.
Figure 2
Figure 2
pH variation of ionic concentrations in triprotic equilibrium for phosphoric acid solutions. Different pH alters the relative concentrations of the four protonated forms of phosphoric acid and thus both the chemical composition and the amount of calcium phosphate crystals. Reprinted from ref . Copyright 2005 American Chemical Society.
Figure 3
Figure 3
Time-resolved SLS measurements for the transition from ACP to HAP. (a) Change in apparent molecular weight and gyration radius of aggregates. (b) Change in fractal dimension of aggregates. The molecular weight and the fractal dimension of the aggregates increased and reached a plateau with time. However, the change in the gyration radius remained almost constant. See text for details. Reprinted with permission from ref . Copyright 2006 from Elsevier.
Figure 4
Figure 4
(A) Schematic plot of ln ts against 1/[ln(1 + σ)] for nucleation. Within the range of supersaturations, two fitted lines with different slopes intercept each other, dividing the space into two regimes. (B) Supersaturation-driven interfacial structure mismatch. With increase of supersaturation, the interfacial correlation factor f(m) will increase abruptly at a certain supersaturation corresponding to the transition from an orderly and matched structure to a more mismatched state of the crystal/substrate interface. (C) Effect of additives on the interfacial correlation factor f(m) and the nucleation kinetics. A promotion or inhibition effect will lower or increase, respectively, the interfacial correlation factor f(m) in the ln(ts) ~1/[ln(1 + σ)] plot (a.u., arbitrary units). Reprinted with permission from refs and . Copyright 2004 and 2005 American Society for Biochemistry and Molecular Biology.
Figure 5
Figure 5
(a) Representative CC nucleation data plot, (b) HAP nucleated in the presence of 5.0 μg mL−1 Amel, and (c) HAP nucleated in the absence of Amel. Modified with permission from ref Copyright 2008 American Chemical Society.
Figure 6
Figure 6
(a) Low magnification TEM image of nanorods at stage I in the presence of 5.0 μg mL−1 Amel. (b) HRTEM image taken from rectangle 1 in Figure 6a, revealing that the less mineralized area of the nanorods consists of nanocrystallites ~3–5 nm in diameter (indicated by dotted circles). The SAED pattern corresponds to the (002) plane of HAP (right inset, Figure 6b). Some adjacent 3- to 4-nm particles aggregated, and their structures adopted parallel orientations in three dimensions, as shown by two white dotted circles and their enlargement (left inset, Figure 6b). (c) Illustration of the proposed mechanism of in vitro hierarchically organized microstructure formation by self-assembly of nucleated apatite nanocrystallite-Amel nanosphere mixtures based on experimental evidence (solid arrows) and theoretical analysis (dotted arrows). Reprinted with permission from ref . Copyright 2008 American Chemical Society.
Figure 7
Figure 7
Illustration of self-epitaxial nucleation and growth. Regime A, normal single crystal growth at relatively low supersaturations. Regime B at low supersaturations, well aligned self-epitaxial nucleation and growth on crystal prism faces, resulting in small-angle self-epitaxial mismatch. At high supersaturations, self-epitaxial nucleation and growth results in wide-angle self-epitaxial branching (a.u. = arbitrary units). Reprinted with permission from ref . Copyright 2004 the American Society for Biochemistry and Molecular Biology.
Figure 8
Figure 8
Schematic representation (free-energy and diameter axes do not have numerical values) of energetics of two different polymorphs as a function of particle radius. Differences in critical nucleus size and activation energy and crossover in phase stability of nanoparticles are shown. Reprinted with permission from ref . Copyright 2004 the National Academy of Sciences, U.S.A.
Figure 9
Figure 9
Normalized rates of growth of DCPD, OCP, and HAP in the presence of magnesium ions. R and R0 are the rates of growth (mol min−1 m−2) in the presence and absence of magnesium, respectively. Reprinted with permission from ref . Copyright 1985 the American Chemical Society.
Figure 10
Figure 10
Model of porcine osteocalcin (pOC) engaging a HAP crystal based on a Ca2+ ion lattice match. (a) Alignment of pOC-bound (purple) and HA (green) Ca2+ ions. (b, c) Orientation of pOC-bound Ca2+ ions in a sphere of a HA-Ca lattice (b) and on the HA surface (c). In part b, the parallelogram indicates a unit cell; the box approximates the boundary of the slab shown in parts c and d. (d) Docking of pOC (orange backbone with gray semitransparent surface) on HAP. (e) Detailed view of part d showing the Ca–O coordination network at the pOC–HA interface. Yellow broken lines denote ionic bonds. Isolated red spheres and tetrahedral clusters of magenta and red spheres represent OH and PO43− ions, respectively. Reprinted with permission from ref . Copyright 2003 Nature Publishing Group.
Figure 11
Figure 11
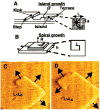
Illustration of growth at a crystal surface by attachment of molecules to step edges on either islands (A) or dislocation spirals (B). (C and D) Sequential AFM images showing the portion of the growth spiral with L < Lc at t = 0 and L > Lc at t = 25 s. Step edges with arrows are advancing. L is the length of a step edge, Lc is the critical length of a step edge, a is the distance between two adjacent atoms in the crystal lattice, v is the velocity of step movement, R is the growth rate, and h is the step height. Reprinted with permission from ref . Copyright 2003 Mineralogical Society of America.
Figure 12
Figure 12
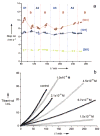
(a) Evolution of the velocities of all three steps for DCPD crystals grown in solutions with and without citrate. All experimental conditions were kept constant, and there was no change in the spreading rates of steps in the absence and presence of citrate. The vertical red dotted lines indicate the time at which the crystals were exposed to a pure growth solution supersaturated with calcium phosphate (marked as B areas), while the blue dotted lines indicate the times at which the growth solutions contained citrate. In areas A1, A2, A3, and A4, the citrate concentrations were 1.0 × 10⁻⁶, 5.0 × 10⁻⁶, 1.0 × 10⁻⁵, and 2.0 × 10⁻⁵ M, respectively. (b) CC growth curves of brushite in the presence of citrate. The relative supersaturation with respect to brushite (σ) was 0.250; the pH value and ionic strength were 5.60 and 0.15 M, respectively; the curves have been normalized to the same seed mass of 10.0 mg. Reprinted with permission from ref . Copyright 2005 from Wiley-VCH.
Figure 13
Figure 13
(a, b) AFM movie frames of brushite dissolution on (010) surfaces near the equilibrium condition of σ = 0.060. The significant developments are only observed for the large pit steps. The smaller ones are almost stationary (pit 1) in comparison with the large pits, and they make extremely small contributions to the reaction (pit 2). Some of the small pits even disappear from the surface (pit 3) during dissolution. The black lines indicate the displacement directions. The scale of the images is 5 μm. (c) Step displacement rates as a function of size for (201) and (001) steps at undersaturation values of σ = 0.060 and 0.172, respectively. The lines are plotted according to eq 4.2. A direct relationship between the dissolution rate and the length of the dissolution step is shown at the micron level (the relative undersaturation is defined by σ = 1 − S to make it positive in dissolution experiments, pH = 4.50, I = 0.15 mol L−1, 37 °C). Reproduced by permission from ref . Copyright 2004 from Wiley-VCH.
Figure 14
Figure 14
In vitro CC dissolution of synthetic HAP. (a) CC plots of titrant volume against time at different undersaturations. The red lines indicate the titrant volumes for full dissolution of the added seeds. Only at very high undersaturation (S = 0.02), does the dissolution go to completion. The dissolution rates decrease with time, and eventually, only a fraction of the added seeds undergo dissolution before the rates approach zero. Near equilibrium (S = 0.828), no dissolution can be detected in the undersaturated solutions. For the smaller hydroxyapatite seeds (length, 200–300 nm; width, 50–80 nm), no CC dissolution can be detected at an even higher undersaturation of S ≥ 0.720. This value for enamel is S ≥ 0.4, showing the much less extensive dissolution. (b) SEM of seed crystals and (c) crystallites remaining at the end of dissolution experiments at S = 0.580 and (d) S = 0.315. Reprinted with permission from ref . Copyright 2004 from Wiley-VCH.
Figure 15
Figure 15
Demineralization of dental enamel: yellow and orange labels mark the dissolution of the walls and cores, respectively, thus showing that they undergo similar dissolution processes. (a) Well-organized rod structures on mature human enamel surfaces: both the walls and cores are composed of numerous needlelike apatites that have the same chemical and physical properties. However, the crystallites in the cores are oriented perpendicular to the enamel surface while those on the walls are inclined by 10–40°. (b) During dissolution, crystallites become smaller and nanosized apatite particles (shown by green arrows) are formed on both walls and cores. (c) After 7 days of dissolution, the cores are emptied but the walls remain. (d) Nanosized apatite particles collected from the bulk solution by filtration (Nucleopore N003 filter membrane) at the end of dissolution experiment. These particles have escaped from cores and walls but are resistant to further dissolution even though the solution is undersaturated. (e) SEM of the wall at higher magnification; nanosized apatite residues, retained on the wall surfaces, are kinetically protected against further dissolution. Reprinted with permission from ref . Copyright 2004 from Wiley-VCH
Figure 16
Figure 16
CC curves of (a) primary and (b) permanent tooth enamel dissolution. The rates decreased virtually to zero at the end of dissolution reactions. (c) Comparison of dissolution rates of primary and permanent tooth enamel during the initial linear stages of dissolution. Reproduced by permission from ref . Copyright 2006 International and American Association of Dental Research.

Similar articles

Cited by

References

    1. Dorozhkin SV. J Mater Sci. 2007;42:1061. - PubMed
    1. Koutsoukos PG, Amjad Z, Tomson MB, Nancollas GH. J Am Chem Soc. 1980;102:1553.
    1. Johnsson MSA, Nancollas GH. Crit Rev Oral Biol Med. 1992;3:61. - PubMed
    1. Dorozhkin SV, Epple M. Angew Chem, Int Ed. 2002;41:3130. - PubMed
    1. Elliot JC. Structure and Chemistry of the Apatites and Other Calcium Orthosphosphates. Elsevier: Amsterdam; 1994.

Publication types