. 2008 Sep 25:9:399.
doi: 10.1186/1471-2105-9-399.

Presenting and exploring biological pathways with PathVisio

Affiliations

Presenting and exploring biological pathways with PathVisio

Martijn P van Iersel et al. BMC Bioinformatics. .

Abstract

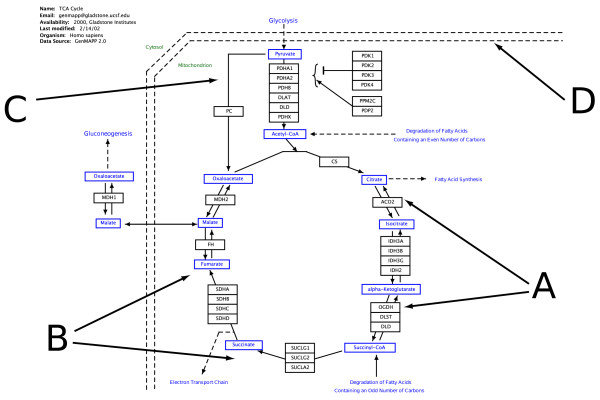
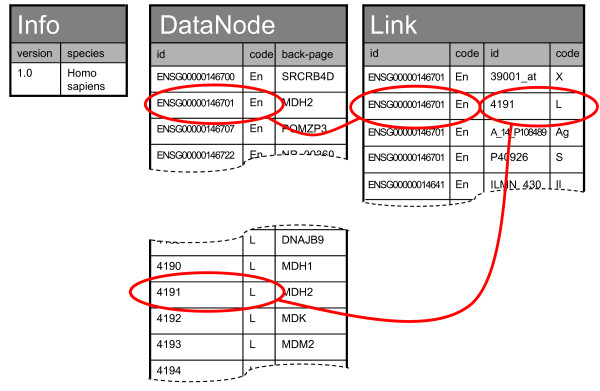
Background: Biological pathways are a useful abstraction of biological concepts, and software tools to deal with pathway diagrams can help biological research. PathVisio is a new visualization tool for biological pathways that mimics the popular GenMAPP tool with a completely new Java implementation that allows better integration with other open source projects. The GenMAPP MAPP file format is replaced by GPML, a new XML file format that provides seamless exchange of graphical pathway information among multiple programs.

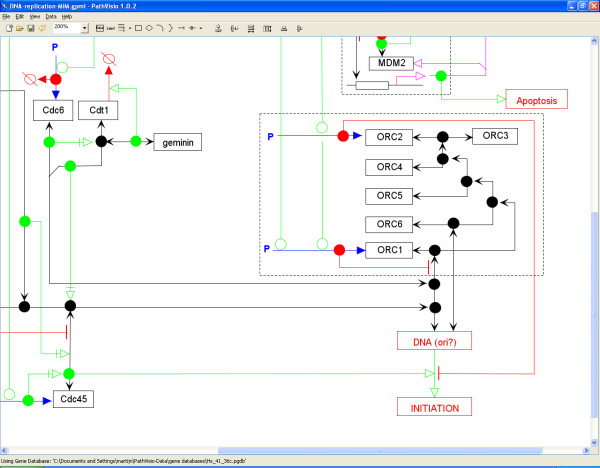
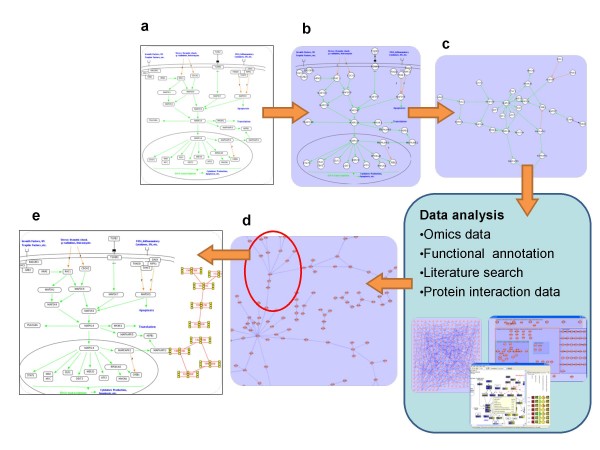
Results: PathVisio can be combined with other bioinformatics tools to open up three possible uses: visual compilation of biological knowledge, interpretation of high-throughput expression datasets, and computational augmentation of pathways with interaction information. PathVisio is open source software and available at http://www.pathvisio.org.

Conclusion: PathVisio is a graphical editor for biological pathways, with flexibility and ease of use as primary goals.


Figures

Figure 1
Figure 1
Pathway data model. A biological pathway as represented by PathVisio has three main classes of objects: DataNodes, Lines and Shapes. The most important are the DataNodes, represented by boxes. These data nodes can represent genes, proteins (A), or metabolites (B). DataNodes can be linked to an online database; in this example, MDH2 is linked to Entrez gene accession no 4191, and Malate is linked to HMDB identifier HDMB03256. DataNodes can be grouped to represent certain biological relationships. In this example, IDH3A, IDH3B and IDH3G are grouped to indicate that they form three subunits of a protein complex. A second class of objects is formed by lines, t-bars, and arrows that represent interactions between data nodes (C). Various shapes and text labels can be used to explain the pathway. In this example, shapes are used to distinguish the cytosol from the mitochondrion. (D). Pathways are stored in the GPML file format [see additional file 1] The PathVisio source code includes an XML Schema definition that can be used for checking the validity of GPML files.
Figure 2
Figure 2
Synonym database schema. This figure represents the database schema for the synonym databases. There are three tables, Info, DataNode and Link. Info provides meta-data on the database. DataNode provides per-gene information, and Link provides a many-to-many relation between entries in the DataNode table that is used to store cross-references. The id column contains accession numbers from online biological databases. Systemcode is a short code (usually one or two letters) that represents the biological database that the id belongs to. A back-page is a short summary of the entity with HTML mark-up, containing at least a one-line description.
Figure 3
Figure 3
Example of a Molecular Interaction Map drawn in PathVisio. The original source for this pathway was published previously by Aladjem et al.[22] The pathway is stored in GPML format [see Additional file 2].
Figure 4
Figure 4
Network analysis workflow. This workflow suggests a way to combine manual pathway data and results from network analysis. A pathway in GPML format (a) can be copied to the Cytoscape network analysis program (b) with copy and paste commands. This program is useful for viewing the pathway as a network (c) without any extra graphical annotation. The rich plug-in set of Cytoscape can be used in various ways to extend this network. If the extended network contains new information that turns out to be instructive, it may be useful to transfer part of this network (d) back to PathVisio again (e) to add manual layout and graphical annotation.

References

    1. Salomonis N, Hanspers K, Zambon AC, Vranizan K, Lawlor SC, Dahlquist KD, Doniger SW, Stuart J, Conklin BR, Pico AR. GenMAPP 2: new features and resources for pathway analysis. BMC Bioinformatics. 2007;8:217. doi: 10.1186/1471-2105-8-217. - DOI - PMC - PubMed
    1. Doniger SW, Salomonis N, Dahlquist KD, Vranizan K, Lawlor SC, Conklin BR. MAPPFinder: using Gene Ontology and GenMAPP to create a global gene-expression profile from microarray data. Genome Biol. 2003;4:R7. doi: 10.1186/gb-2003-4-1-r7. - DOI - PMC - PubMed
    1. Shannon P, Markiel A, Ozier O, Baliga NS, Wang JT, Ramage D, Amin N, Schwikowski B, Ideker T. Cytoscape: a software environment for integrated models of biomolecular interaction networks. Genome Res. 2003;13:2498–2504. doi: 10.1101/gr.1239303. - DOI - PMC - PubMed
    1. Cavalieri D, Castagnini C, Toti S, Maciag K, Kelder T, Gambineri L, Angioli S, Dolara P. Eu.Gene Analyzer a tool for integrating gene expression data with pathway databases. Bioinformatics. 2007;23:2631–2632. doi: 10.1093/bioinformatics/btm333. - DOI - PubMed
    1. BioPAX wiki http://www.biopax.org/

Publication types