. 2008 Sep 25:1:14.
doi: 10.1186/1756-8722-1-14.

Effect of arginase II on L-arginine depletion and cell growth in murine cell lines of renal cell carcinoma

Affiliations

Effect of arginase II on L-arginine depletion and cell growth in murine cell lines of renal cell carcinoma

David J Tate Jr et al. J Hematol Oncol. .

Abstract

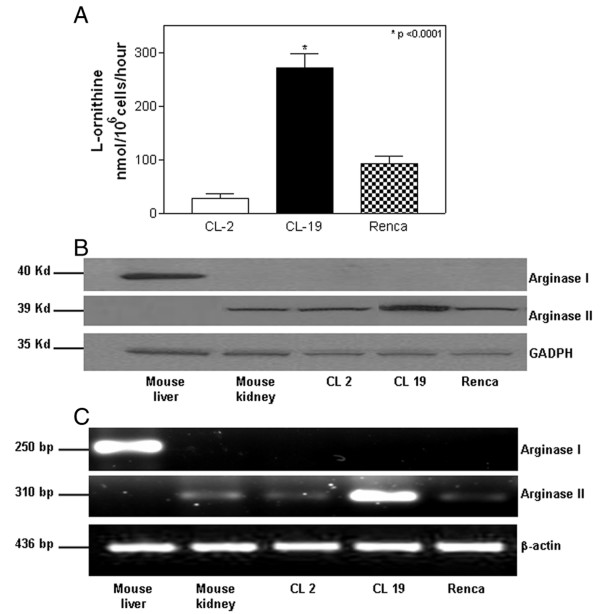
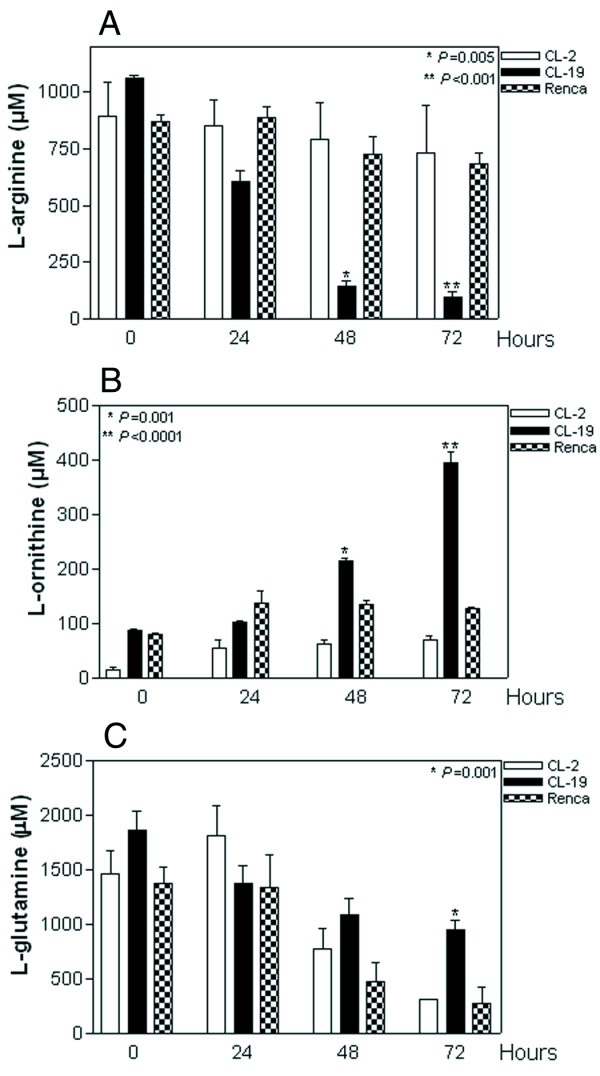
Background: L-arginine is the common substrate for the two isoforms of arginase. Arginase I, highly expressed in the liver and arginase II mainly expressed in the kidney. Arginase I-producing myeloid derived suppressor cells have been shown to inhibit T-cell function by the depletion of L-arginine. On the other hand, arginase II has been detected in patients with cancer and is thought to metabolize L-arginine to L-ornithine needed to sustain rapid tumor growth; however its role in L-arginine depletion is unclear. Thus, in tumor biology, L-arginine metabolism may play a dual role in tumor growth and in the induction of T cell dysfunction. Therefore, we studied in murine renal cell carcinoma (RCC) cell lines, the effect of arginase II on tumor cell proliferation and L-arginine depletion. The effect of arginase inhibitors on cell proliferation was also tested.

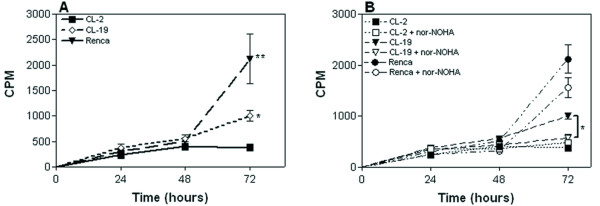
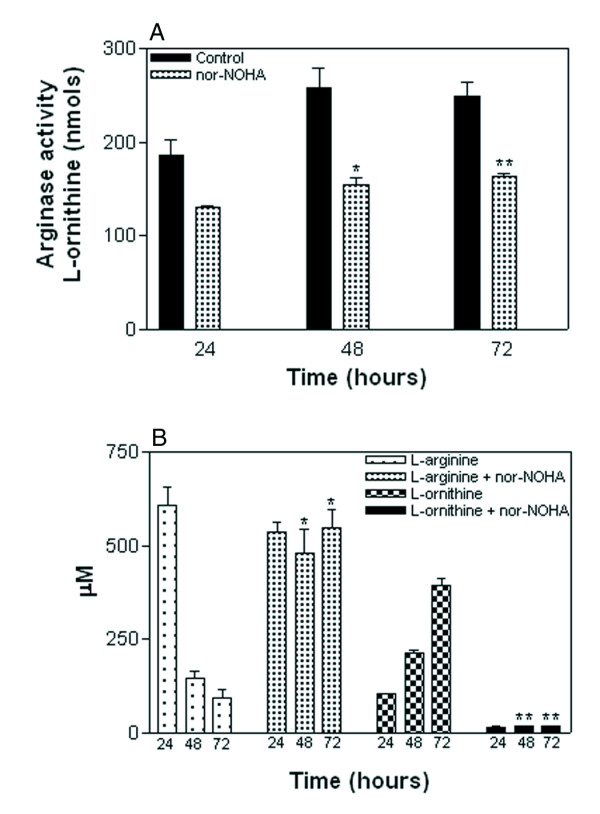
Methods: Three murine renal cell carcinoma (mRCC) cell lines were tested for the presence of arginase. nor-NOHA, an arginase inhibitor was used to substantiate the effect of arginase on cell growth and L-arginine depletion. Amino acid levels were tested by HPLC.

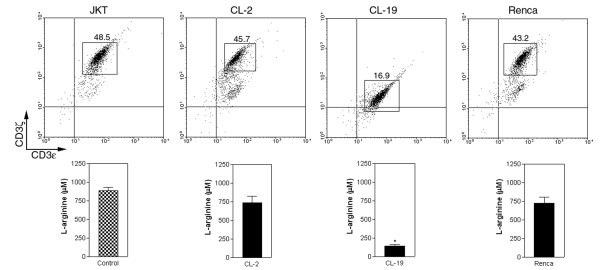
Results: Our results show that mRCC cell lines express only arginase II and were able to deplete L-arginine from the medium. Cell growth was independent of the amount of arginase activity expressed by the cells. nor-NOHA significantly (P = 0.01) reduced arginase II activity and suppressed cell growth in cells exhibiting high arginase activity.The depletion of L-arginine by mRCC induced the decrease expression of CD3zeta a key element for T-cell function.

Conclusion: The results of this study show for the first time that arginase II produced by RCC cell lines depletes L-arginine resulting in decreased expression of CD3zeta. These results indicate that RCC cell lines expressing arginase II can modulate the L-arginine metabolic pathway to regulate both cell growth and T-cell function. Blocking arginase may lead to a decrease in RCC cell growth and aid in restoring immune function by increasing L-arginine availability for T-cell use. Understanding the interplay between arginase II and its interaction with the immune system may provide future therapeutic benefits to treat patients with RCC.


Figures

Figure 1
Figure 1
Arginase II expression in mRCC cell lines. (A) After 48 hours in culture, CL-19 cells presented significantly more arginase activity (*P < 0.0001) than did either CL-2 or Renca cells. Similar results were found after 72 hours in culture. (B) Twenty five micrograms of protein were tested for arginase I and arginase II expression by Western blot analysis. Normal mouse liver and kidney were used as positive controls for arginase I and arginase II respectively, whereas GAPDH was used as house keeping protein. (C) Total RNA from CL-2, CL-19 and Renca cells were obtained by TRIzol extraction and 1 μg of RNA was tested for arginase I, arginase II, and β-actin by RT-PCR. DNA fragment sizes generated by RT-PCR: arginase I, 250 bp; arginase II, 310 bp; and β-actin, 436 bp. These data are from a single experiment that is representative of five separate experiments.
Figure 2
Figure 2
L-arginine, L-ornithine and L-glutamine levels. Tissue culture supernatants from CL-2, CL-19, and Renca cells were collected at 24, 48, and 72 hours. They were analyzed by HPLC after deproteinization with methanol and derivatization with OPA for (A) L-arginine and (B) L-ornithine and (C) L-glutamine. Standards of L-arginine, L-ornithine and L-glutamine in methanol were run with each experiment. Results are expressed as means ± SE of duplicate determinations from four independent experiments. (* P = 0.005. ** P < 0.0001 significant differences for CL-19 compared to the other cell lines).
Figure 3
Figure 3
Effect of arginase inhibitor nor-NOHA on cell proliferation. (A) Proliferation of CL-2, CL-19 and Renca cells was assessed by [3H]-thymidine incorporation at 24, 48, and 72 hours in culture. At 72 hours, the growth rates for CL-19 and Renca cells were significantly greater than CL-2 (* P = 0.009 and ** P = 0.003 respectively). (B) nor-NOHA (2 mM) and [3H]-thymidine were added at the same time and cell proliferation was determined at 24, 48, and 72 hrs. Cultured cells without the inhibitor were used as controls. Only CL-19 proliferation was significantly inhibited (* P = 0.010) compared to the untreated control cells. Results are expressed as CPM means ± SE of triplicate determinations from five independent experiments.
Figure 4
Figure 4
Effect of nor-NOHA on arginase activity and amino acid levels. (A) Significant arginase inhibition was observed in cell lysates of CL-19 cultures treated with nor-NOHA (2 mM) after 48 (*P = 0.002) and 72 hours (** P = 0.001) as compared to untreated cells. (B) Effect of nor-NOHA in inhibiting both L-arginine (μM) depletion (*P = 0.001) and L-ornithine (μM) production (**P < 0.0001) in the supernatants of CL-19 cultures, as compared to CL-19 untreated cultures. Results are expressed as means ± SE of duplicate determinations from four independent experiments.
Figure 5
Figure 5
L-arginine deprivation and its effect on CD3ζ expression. (Upper panel) Expression of CD3ζ in Jurkat T-cells (JKT) cultured for 48 hours alone (control) or co-cultured in trans-wells with CL-2, CL-19, or Renca cell. Differences in CD3ζ expression were measured by mean fluorescence intensity. (Lower panel) L-arginine levels in supernatants after 48 hours of co-culture of Jurkat cells with the cell lines. Levels of L-arginine were significantly lower (* P < 0.001) in CL-19 co-cultures than in Jurkat control or in co-cultures with CL-2 and Renca cell lines. Data shown is representative of a single experiment at 48 hours in culture.

References

    1. Brittenden J, Heys SD, Ross J, Park KG, Eremin O. Nutritional pharmacology: effects of L-arginine on host defences, response to trauma and tumour growth. Clin Sci (Lond) 1994;86:123–132. - PubMed
    1. Albina JE, Caldwell MD, Henry WL, Jr, Mills CD. Regulation of macrophage functions by L-arginine. J Exp Med. 1989;169:1021–1029. doi: 10.1084/jem.169.3.1021. - DOI - PMC - PubMed
    1. Ochoa JB, Strange J, Kearney P, Gellin G, Endean E, Fitzpatrick E. Effects of L-arginine on the proliferation of T lymphocyte subpopulations. JPEN J Parenter Enteral Nutr. 2001;25:23–29. doi: 10.1177/014860710102500123. - DOI - PubMed
    1. Wu G, Morris SM., Jr Arginine metabolism: nitric oxide and beyond. Biochem J. 1998;336:1–17. - PMC - PubMed
    1. Pegg AE, McCann PP. Polyamine metabolism and function. Am J Physiol. 1982;243:C212–C221. - PubMed