. 2008 Dec 5;283(49):33942-54.
doi: 10.1074/jbc.M801844200. Epub 2008 Sep 25.

Specific TRPC6 channel activation, a novel approach to stimulate keratinocyte differentiation

Affiliations

Specific TRPC6 channel activation, a novel approach to stimulate keratinocyte differentiation

Margarethe Müller et al. J Biol Chem. .

Abstract

The protective epithelial barrier in our skin undergoes constant regulation, whereby the balance between differentiation and proliferation of keratinocytes plays a major role. Impaired keratinocyte differentiation and proliferation are key elements in the pathophysiology of several important dermatological diseases, including atopic dermatitis and psoriasis. Ca(2+) influx plays an essential role in this process presumably mediated by different transient receptor potential (TRP) channels. However, investigating their individual role was hampered by the lack of specific stimulators or inhibitors. Because we have recently identified hyperforin as a specific TRPC6 activator, we investigated the contribution of TRPC6 to keratinocyte differentiation and proliferation. Like the endogenous differentiation stimulus high extracellular Ca(2+) concentration ([Ca(2+)](o)), hyperforin triggers differentiation in HaCaT cells and in primary cultures of human keratinocytes by inducing Ca(2+) influx via TRPC6 channels and additional inhibition of proliferation. Knocking down TRPC6 channels prevents the induction of Ca(2+)- and hyperforin-induced differentiation. Importantly, TRPC6 activation is sufficient to induce keratinocyte differentiation similar to the physiological stimulus [Ca(2+)](o). Therefore, TRPC6 activation by hyperforin may represent a new innovative therapeutic strategy in skin disorders characterized by altered keratinocyte differentiation.


Figures

FIGURE 1.
FIGURE 1.
Hyperforin induces differentiation in HaCaT keratinocytes and hPKs. Both cell types were treated with Ca2+ (2 mm) and hyperforin (Hyp, 1 μm) for 3 days. A, after the incubation period, cells were stained with Mayer's hematoxylin and eosin solutions. Representative images of HaCaT cells are shown from at least three experiments. B, Western blotting of differentiation marker proteins K1 and K10. Comparability was achieved by GAPDH-normalizing of protein load. Shown is a representative blot from a single experiment that was repeated three times. Total mRNA of treated HaCaT cells (C) or hPKs (D) was isolated, reverse transcribed, and subjected to PCR. The expression of differentiation markers in untreated and with hyperforin (1 μm) or Ca2+ (2 mm) differentiated HaCaT keratinocytes was analyzed. E and F, histograms showing relative expressing levels of differentiation markers in HaCaT keratinocytes (E) and hPKs (F), compared with their normalized expression levels in untreated control cells. The asterisks denote statistical significance as compared with control HaCaT keratinocytes or hPKs (n = 3; *, p < 0.1, unpaired t test).
FIGURE 2.
FIGURE 2.
Hyperforin inhibits proliferation in HaCaT keratinocytes. HaCaT keratinocytes were incubated for 3 days with Ca2+ (2 mm) or hyperforin (Hyp, 1 μm). A, the proliferation measurement in synchronized HaCaT cells was performed with the bromodeoxyuridine immunoassay kit (Calbiochem), according to the manufacturers instructions. Synchronization was achieved by 24 h serum withdrawn. The relative changes in percentage in the absorbance at 450 nm compared with the untreated control were measured (n = 3; *, p < 0.1, unpaired t test). B, Western blotting of Ki-67 in protein samples taken from untreated (control) or treated HaCaT cells, compared with GAPDH. Shown is a representative blot from a single experiment that was repeated three times. C, HaCaT cells were treated with hyperforin at different concentrations (0.3–3 μm) for 48 h. The relative changes in percentage in the MTT reduction compared with the untreated control were measured (n = 3).
FIGURE 3.
FIGURE 3.
Hyperforin induces nonselective cation influx in HaCaT keratinocytes. A, representative time traces show hyperforin-induced changes in [Ca2+]i in fura-2-loaded HaCaT and hPK cells. Hyperforin (Hyp, 10 μm) was added 50 s after the start of the experiment. B, HaCaT cells and hPKs were stimulated with various concentration of hyperforin (n = 6).
FIGURE 4.
FIGURE 4.
Carbachol-, 1-oleoyl-2-acetyl-sn-glycerol-, and hyperforin-induced current in HaCaT keratinocytes. Whole cell recording of unselective cation currents in HaCaT cells were obtained in response to 1-oleoyl-2-acetyl-sn-glycerol (OAG, A), carbachol (CCh, B), and hyperforin (hyp, C). The data are gathered from voltage ramp from –100 to +100 mV. Left panels, currents measured at –100 and +100 mV are plotted over time. The presence of the drugs is shown by horizontal bars. Middle panels, shown are the corresponding IV relationships of the cells in the left panels measured before and during maximal agonist response. Right panels, the mean current amplitudes are presented as bars (n = 8 for 100 μm 1-oleoyl-2-acetyl-sn-glycerol, n = 6 for 100 μm carbachol, n = 13 for 2–10 μm hyperforin). Ctr, control.
FIGURE 5.
FIGURE 5.
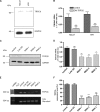
Hyperforin selectively activates TRPC6 channels in HaCaT keratinocytes and hPKs. A, Western blotting of HaCaT cells and hPKs confirms the presence of TRPC6 channel protein in both cell types. B, HaCaT cells and hPKs were transfected with TRPC6-DN-YFP. 48 h after transfection, the cells were loaded with fura-2-AM and were stimulated with hyperforin. The asterisks denote statistical significance as compared with untransfected keratinocytes (n = 12, 5–10 cells/independent experiment; ***, p < 0.001, unpaired t test). C, we analyzed HaCaT keratinocytes transfected with control as well as three different anti-TRPC6 siRNAs abbreviated with RNAi 1–3. Because GC content of the anti-TRPC6 siRNAs, we used a random RNAi with low GC content to control RNAi 1–3. RNAi-transfected HaCaT cells were analyzed by Western blot using anti-GAPDH and anti-TRPC6 antibodies. Staining with an anti-TRPC6 antibody resulted in a single band with a molecular mass of around 97 kDa. D, HaCaT cells were transfected with anti-TRPC6 RNAis (RNAi 1, 2, and 3) and control RNAi with low GC content (Low GC). In addition, untransfected cells were used as additional control. After an incubation period of 48 h, HaCaT cells were loaded with fura-2 and were stimulated with hyperforin (10 μm)(n = 6, 5–10 cells/independent experiment. ***, p < 0.001, unpaired t test; ns, nonsignificant. E, the effectiveness of RNAi transfection was determined in RT-PCR analyses. F, histogram reflecting relative expressing level of TRPC6, normalized to its expression level in untransfected control cells. The asterisks denote statistical significance as compared with control HaCaT keratinocytes (n = 3; ***, p < 0.001, unpaired t test).
FIGURE 6.
FIGURE 6.
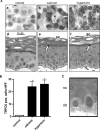
Hyperforin induces TRPC6 expression in human hPKs in vitro (A, panels a–c) and in living human skin ex vivo (A, panels d–f, and B and C). A, panels ac, hPKs were incubated for 24 h in Ca2+-free medium (control), 2 mm Ca2+ (positive control), or 1 μm hyperforin. After centrifugation onto cytospin slides, the cells were stained for TRPC6 expression (red staining, see arrow). Representative images (×400 magnification) from four independent experiments are shown. A, panels df, and B and C, split thickness skin organ culture. Skin explants obtained from dermatome-separated human skin were incubated for 24 h in Ca2+-free medium (control), 2 mm Ca2+ (positive control), or 1 μm hyperforin. 3-μm sections were stained for TRPC6 (red staining). Representative sections of high power fields are shown in A, panels df. The arrows indicate TRPC6-positive cells. Positive staining of the stratum corneum (sc) indicates accumulation of TRPC6 protein in the keratin envelope of the epidermis. Five random fields of sections from four independent skin explants were counted for TRPC6-positive keratinocytes at ×400 magnification. The final count/group represents the mean ± S.D. B, *, p < 0.05. Note the absence of TRPC6 expression in stratum basale (sb) keratinocytes but strong positivity of stratum spinulosum (ss) keratinocytes as illustrated in a detail from Ca2+-treated skin (C).
FIGURE 7.
FIGURE 7.
TRPC6 mediates hyperforin-induced differentiation. HaCaT keratinocytes were transfected with TRPC6-DN, anti-TRCP6 RNAis, or control RNAi with low GC content and incubated for 3 days with hyperforin (Hyp, 1 μm). A, anti-TRPC6 RNAis and RNAi control transfected HaCaT cells were incubated for 3 days with hyperforin (1 μm) and stained with Mayer's hematoxylin and eosin solutions. Representative images demonstrate how TRPC6 silencing affects the hyperforin-induced morphology changes. B, keratinocytes were stained with Mayer's hematoxylin and eosin solutions. Representative images of untransfected or DN-TRPC6-transfected HaCaT cells treated with hyperforin (1 μm) are shown from at least three experiments. C, expression of differentiation markers in untreated (untransfected and DN-TRPC6 transfected) HaCaT cells and hyperforin-treated (1 μm) (untransfected or DN-TRPC6 transfected) cells was determined in RT-PCR analysis. D, histogram reflecting relative expressing levels of differentiation markers, compared with their normalized expression levels in untransfected, untreated HaCaT cells. The asterisks denote statistical significance as compared with control HaCaT keratinocytes (n = 3; *, p < 0.1, unpaired t test). E, HaCaT keratinocytes were incubated for 3 days with calcium (2 mm) and hyperforin (1 μm). Total mRNA was isolated, reverse transcribed, and subjected to PCR. Expression of TRPC6 was detected. F, histogram reflecting the quantitative changes in TRPC6 expression following Ca2+- and hyperforin-induced differentiation (n = 3).
FIGURE 8.
FIGURE 8.
TRCP6 is involved in the high extracellular Ca2+ concentration-induced differentiation. A, representative time traces show high extracellular Ca2+-induced changes in [Ca2+]i in fura-2-loaded HaCaT cells. Ca2+ (2 mm) was added 50 s after start of experiment. B, HaCaT cells were transfected with anti-TRPC6 RNAis (RNAi 1, 2, and 3) and control RNAi with low GC content (Low GC). In addition, untransfected cells were used as additional control. After an incubation period of 48 h, HaCaT cells were loaded with fura-2 and were stimulated with Ca2+ (2 mm)(n = 6, 5–10 cells/independent experiment; *, p < 0.1; **, p < 0.01, unpaired t test; ns, nonsignificant). C, anti-TRPC6 RNAis and RNAi control transfected HaCaT cells were incubated for 3 days with Ca2+ (2 mm) and stained with Mayer's hematoxylin and eosin solutions. Representative images demonstrate how TRPC6 silencing affects the high extracellular Ca2+-induced morphology changes. D, expression of differentiation markers in anti-TRPC6 RNAis (RNAi 1, 2, and 3), control RNAi-transfected and untransfected HaCaT cells was determined in RT-PCR analysis. HaCaT cells were incubated for 3 days with Ca2+ (2 mm). E, histogram reflecting relative expressing levels of differentiation markers, compared with their normalized expression levels in untransfected, untreated HaCaT cells. The asterisks denote statistical significance as compared with control HaCaT keratinocytes (n = 3; *, p < 0.1; **, p < 0,01 unpaired t test).
FIGURE 9.
FIGURE 9.
Role of other TRPC channels in hyperforin- and high calcium-induced effects in keratinocytes. HaCaT keratinocytes were transfected with control siRNA and the respective siRNA for every TRPC channel. After an incubation period of 48 h, HaCaT cells were loaded with fura-2 and were stimulated with hyperforin (A) or Ca2+ 2 mm (B)(n = 6; *, p < 0.1; **, p < 0.01, unpaired t test; ns, nonsignificant). C, the effectiveness of the respective RNAi transfection was analyzed in RT-PCR experiments. D, histogram showing the relative expression of the TRPC channels, compared with their normalized expression levels in untransfected, untreated HaCaT cells (n = 3).

Similar articles

Cited by

References

    1. Yuspa, S. H., Kilkenny, A. E., Steinert, P. M., and Roop, D. R. (1989) J. Cell Biol. 109 1207–1217 - PMC - PubMed
    1. Lowes, M. A., Bowcock, A. M., and Krueger, J. G. (2007) Nature 445 866–873 - PubMed
    1. Bovenschen, H. J., Seyger, M. M., and Van De Kerkhof, P. C. (2005) Br. J. Dermatol. 153 72–78 - PubMed
    1. Williams, H. C. (2005) N. Engl. J. Med. 352 2314–2324 - PubMed
    1. Proksch, E., Folster-Holst, R., and Jensen, J. M. (2006) J. Dermatol. Sci. 43 159–169 - PubMed

Publication types

MeSH terms