. 2008 Nov 25;105(47):18132-8.
doi: 10.1073/pnas.0800788105. Epub 2008 Sep 25.

Precision proteomics: the case for high resolution and high mass accuracy

Affiliations

Precision proteomics: the case for high resolution and high mass accuracy

Matthias Mann et al. Proc Natl Acad Sci U S A. .

Abstract

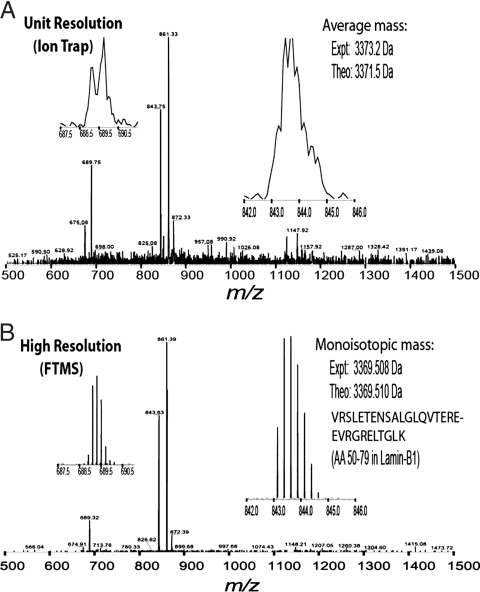
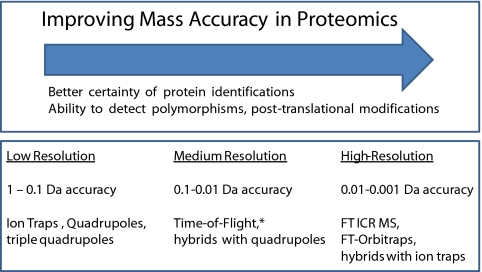
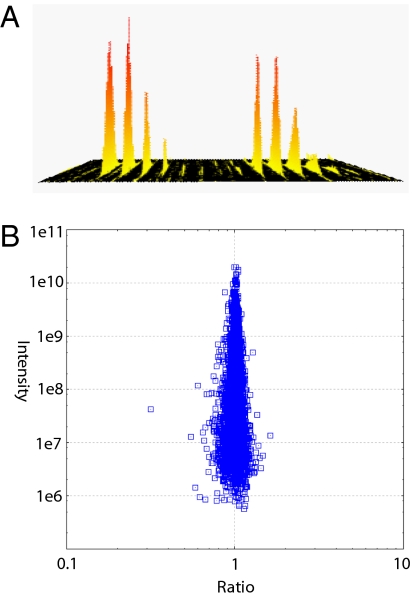
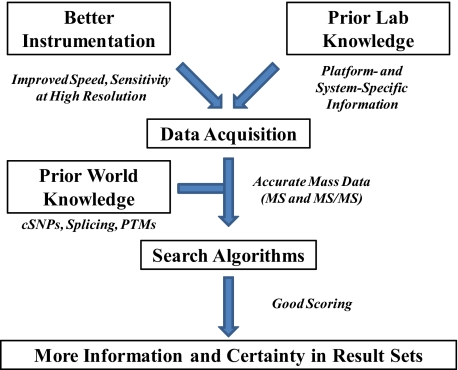
Proteomics has progressed radically in the last 5 years and is now on par with most genomic technologies in throughput and comprehensiveness. Analyzing peptide mixtures by liquid chromatography coupled to high-resolution mass spectrometry (LC-MS) has emerged as the main technology for in-depth proteome analysis whereas two-dimensional gel electrophoresis, low-resolution MALDI, and protein arrays are playing niche roles. MS-based proteomics is rapidly becoming quantitative through both label-free and stable isotope labeling technologies. The latest generation of mass spectrometers combines extremely high resolving power, mass accuracy, and very high sequencing speed in routine proteomic applications. Peptide fragmentation is mostly performed in low-resolution but very sensitive and fast linear ion traps. However, alternative fragmentation methods and high-resolution fragment analysis are becoming much more practical. Recent advances in computational proteomics are removing the data analysis bottleneck. Thus, in a few specialized laboratories, "precision proteomics" can now identify and quantify almost all fragmented peptide peaks. Huge challenges and opportunities remain in technology development for proteomics; thus, this is not "the beginning of the end" but surely "the end of the beginning."


Conflict of interest statement

The authors declare no conflict of interest.

Figures

Fig. 1.
Fig. 1.
A direct comparison of peptides detected at two different resolving powers. A modest mixture of peptides was measured on an ion trap instrument at unit resolution (A) vs. on a Fourier transform instrument at high resolution (B). (Insets) Expanded spectral regions for two individual peptides, with Insets at right highlighting an unmodified Lys-C peptide that is 30 residues long. Note that the natural isotopes mainly due to 13C are clearly resolved at high resolution but not resolved at unit resolution. The spectra shown were obtained during a chromatographic separation, and the theoretical masses shown are for the average (A) and the monoisotopic (B) molecular weight values.
Fig. 2.
Fig. 2.
Overview of the impact that improving mass accuracy has in contemporary proteomics (Upper) along with various flavors of MS instruments and their approximate mass accuracy for tryptic peptides (Lower). The asterisk indicates that the latest models of TOF instruments are approaching the lower end of the resolution range of FTMS instruments.
Fig. 3.
Fig. 3.
Fragmentation spectra for peptides interrogated by using two different workflows. (A) Fragmentation spectrum of a tryptic peptide recorded on a mainstream workflow in contemporary proteomics. Specifically, the intact peptides (not shown) are recorded at high resolution in a FT instrument, and the tandem mass spectrum (MS/MS) of a single tryptic peptide is recorded on a lower-resolution but faster linear quadrupole ion trap (LTQ) instrument during a LC-MS run. (B) Fragmentation spectrum recorded on a developmental workflow where fragment ions produced during MS/MS are recorded at FT resolution and <2 ppm mass accuracy. The high mass accuracy translates to high confidence in database retrieval, even when searching a complex database that includes modifications, polymorphisms, and alternative splicing. The high-resolution MS/MS data shown for a phosphopeptide in B was recorded on a Fourier-transform (LTQ FT) instrument during LC/MS/MS analysis of an endoproteinase Lys-C digestion of human cell line extract. The phosphorylation was stable through the standard MS/MS fragmentation process; it was readily detected and localized because it had been previously reported in the literature and actually stored in the database searched. (The actual phosphopeptide shown is the 230–257 segment from a Ras-GTPase activating protein, NCBI accession no. Q13283.)
Fig. 4.
Fig. 4.
Quantitative determination of a single peptide expression ratio (A), with a representation of thousands of such measurements (B) in a large-scale study of how embryonic stem cells differentiate. Two proteomes were mixed 1:1, and 4,668 proteins with at least three quantitation data points are plotted as a function of fold-change and summed peptide intensities (B). Excellent quantitation accuracy is observed with almost all proteins within 50% of ratio one. Significance of fold change is calculated by protein abundance. Data are from Graumann et al. (26). The quantitative distribution is narrower at 106 than at 107 because there are very few proteins in this abundance class, and these occupy the most probable states close to ratio one.
Fig. 5.
Fig. 5.
Conceptual model for the ongoing development of MS-based proteomics. Along with improving hardware, smarter software at run time and embedding known information on protein variation into database searching are all trends for the future.

Similar articles

Cited by

References

    1. O'Farrell PH. High resolution two-dimensional electrophoresis of proteins. J Biol Chem. 1975;250:4007–4021. - PMC - PubMed
    1. Fountoulakis M, Tsangaris G, Oh JE, Maris A, Lubec G. Protein profile of the HeLa cell line. J Chromatogr A. 2004;1038:247–265. - PubMed
    1. Campostrini N, et al. Spot overlapping in two-dimensional maps: A serious problem ignored for much too long. Proteomics. 2005;5:2385–2395. - PubMed
    1. Petrak J, et al. Deja vu in proteomics. A hit parade of repeatedly identified differentially expressed proteins. Proteomics. 2008;8:1744–1749. - PubMed
    1. Angenendt P, Kreutzberger J, Glokler J, Hoheisel JD. Generation of high density protein microarrays by cell-free in situ expression of unpurified PCR products. Mol Cell Proteomics. 2006;5:1658–1666. - PubMed

Publication types

LinkOut - more resources