. 2008 Dec;18(12):1085-93.
doi: 10.1093/glycob/cwn093. Epub 2008 Sep 25.

Inhibition of the interaction between the SARS-CoV spike protein and its cellular receptor by anti-histo-blood group antibodies

Affiliations

Inhibition of the interaction between the SARS-CoV spike protein and its cellular receptor by anti-histo-blood group antibodies

Patrice Guillon et al. Glycobiology. 2008 Dec.

Abstract

Severe acute respiratory syndrome coronavirus (SARS-CoV) is a highly pathogenic emergent virus which replicates in cells that can express ABH histo-blood group antigens. The heavily glycosylated SARS-CoV spike (S) protein binds to angiotensin-converting enzyme 2 which serves as a cellular receptor. Epidemiological analysis of a hospital outbreak in Hong Kong revealed that blood group O was associated with a low risk of infection. In this study, we used a cellular model of adhesion to investigate whether natural antibodies of the ABO system could block the S protein and angiotensin-converting enzyme 2 interaction. To this aim, a C-terminally EGFP-tagged S protein was expressed in chinese hamster ovary cells cotransfected with an alpha1,2-fucosyltransferase and an A-transferase in order to coexpress the S glycoprotein ectodomain and the A antigen at the cell surface. We observed that the S protein/angiotensin-converting enzyme 2-dependent adhesion of these cells to an angiotensin-converting enzyme 2 expressing cell line was specifically inhibited by either a monoclonal or human natural anti-A antibodies, indicating that these antibodies may block the interaction between the virus and its receptor, thereby providing protection. In order to more fully appreciate the potential effect of the ABO polymorphism on the epidemiology of SARS, we built a mathematical model of the virus transmission dynamics that takes into account the protective effect of ABO natural antibodies. The model indicated that the ABO polymorphism could contribute to substantially reduce the virus transmission, affecting both the number of infected individuals and the kinetics of the epidemic.


Figures
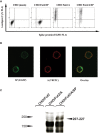
Fig. 1
Fig. 1
CHO cells coexpressing the A histo-blood group antigen and the SARS-CoV S protein. (A) Flow cytometry analysis of the expression of A antigen and the S protein–EFGP construct on CHO mock-transfected cells (mock), double transfectants either with the Fut2 and S protein constructs (Fut2/SP) or the Fut2 and A enzyme cDNAs (Fut2/A), triple transfectants with the Fut2, A enzyme and S protein constructs (Fut2/A/SP). Fluorescence of the S–EFGP molecule was directly recorded on the FL1 channel. Detection of the A antigen was performed using an anti-A mAb followed by Cy5-labeled anti-mouse IgG and recorded on the FL4 channel. (B) Confocal microscopy analysis of the A antigen (A TRITC) and the S protein–EFGP construct coexpression on CHO cells triple transfectants. Detection of the A antigen was performed using an anti-A mAb followed by TRITC-labeled anti-mouse IgG. (C) Western blot analysis of transfected CHO cells glycoproteins. Total protein extracts from CHO Fut2 simple transfectants, CHO Fut2/A double transfectants, and CHO Fut2/A/SP triple transfectants were submitted to SDS–PAGE and Western blotting. Glycoproteins carrying A histo-blood group epitopes were detected with an anti-A mAb. The arrow shows the expected molecular size of the EGFP–SP fusion protein.
Fig. 2
Fig. 2
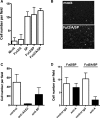
S Protein/ACE2-dependent adhesion of CHO cells to Vero cells. The binding assay between CHO cells and Vero E6 cells was performed as described in Material and methods. Adherent cells were counted under a fluorescence microscope. Cells from a total of 36 fields from 6 wells were counted. (A) The results shown correspond to the mean ± SD of one representative experiment out of four obtained with CHO cells mock transfectants (mock), double transfectants with the Fut2 and A histo-blood group glycosyltransferases (Fut2/A), simple transfectants with the SARS-CoV S protein construct (SP), double transfectants with the Fut2 enzyme and the SARS-CoV S protein construct (Fut2/SP), and triple transfectants with the Fut2, A glycosyltransferases and the SARS-CoV S protein cDNAs (Fut2/A/SP). Adhesion of SP, Fut2/SP, and Fut2/A/SP cells is significantly higher than that of either mock or Fut2/A cells (P < 0.001, Student's t-test). (B) Representative fields illustrating the adhesion of either mock-transfected CHO cells or triple transfectants. (C) Inhibition of the adhesion of triple CHO transfectants to Vero cells by anti-ACE2 or anti-S protein mAbs. The mAbs were added to the CHO cells suspension at 20 and 25 μg/mL, respectively prior to incubation on the Vero cell layer. Adhesion in the presence of the anti-ACE2 and anti-SP are significantly lower than that of control cells (P < 0.001 and P < 0.01, respectively). (D) Inhibition of the adhesion to Vero cells of S protein-transfected CHO cells coexpressing either the H (Fut2/SP) or the A antigen (Fut2/A/SP) by an anti-A mAb or a control isotype matched antibody used at 4 μg/mL. Only the adhesion of the triple transfectants in the presence of the anti-A differs significantly from other conditions (P < 0.01).
Fig. 3
Fig. 3
Effect of anti-A antibodies on the interaction between the SARS-CoV S protein and ACE2. (A) The anti-A monoclonal antibody 3-3A was added at the indicated concentrations to the triple transfected CHO cells suspension prior to incubation on the Vero cell layer. An irrelevant IgG1 was used as control at 4 μg/mL. The results are presented as mean cell number per field ±SD of one representative experiment out of two. From 1.0 μg/mL to 4.0 μg/mL anti-A, values are significantly different from those for the control IgG (P < 0.05 and 0.001, respectively). (B) Adsorption of the anti-A natural antibody from human O plasmas. Plasma samples from two individuals were adsorbed on either control silica beads (mock) or A type 2 tetrasaccharide conjugated to silica beads (At2). The postadsorption plasma reactivity on A type 2 conjugated to polyacrylamide was tested by ELISA. Results are shown as O.D. 450 nm values of duplicate wells ±SD for each plasma sample diluted at 1/4. In the absence of A type 2 conjugate, mean O.D. values were 0.13. (C) Inhibition of the adhesion of CHO triple transfected cells to Vero cells by mock adsorbed (mock) or A type 2 (At2) adsorbed human blood group O plasma samples from individuals 1 and 2. Plasma samples were diluted at 1/8 in PBS. Control values were obtained in the absence of plasma. Values for the mock adsorbed plasma were significantly different from the control values (P < 0.001). (D) Inhibition of the adhesion in the cell-based assay as in C by serial dilutions of unadsorbed plasma from individual 1. All values obtained in the presence of plasma were significantly different from the control value (from P < 0.05 to P < 0.0001).
Fig. 4
Fig. 4
Transmission patterns used to model the effect of the ABO polymorphism. In the absence of ABO effect, transmission can occur irrespective of the ABO type (full arrows in all directions). In the presence of a strong ABO effect, transmission occurs strictly according to the rules of transfusion, whereas in the case of a moderate ABO effect, some incompatible transmission can occur (dashed arrows). Determination of the values of the transmission coefficients β, β1, β2 has been done based on the Hong Kong hospital outbreak data, as described in the supplemental material. Transmission coefficients correspond to the transmission rates of the disease for each contact.
Fig. 5
Fig. 5
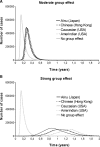
Influence of the ABO polymorphism, with either a moderate group effect (A) or a strong group effect (B) as compared with no group effect, on the number of infected individuals over time in four different populations presenting large differences in the frequencies of ABO phenotypes.
Fig. 6
Fig. 6
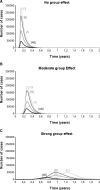
Influence of different transmission patterns, no group effect (A), moderate group effect (B) or strong group effect (C), on the number of infected individuals over time according to their blood groups in the Chinese (Hong Kong) population.

Similar articles

Cited by

References

    1. Anderson RM, Fraser C, Ghani AC, Donnelly CA, Riley S, Fergusson NM, Leung GM, Lam TH, Hedley AJ. Epidemiology, transmission dynamics and control of SARS: The 2002–2003 epidemic. Phil Trans R Soc Lond B. 2004;359:1091–1105. - PMC - PubMed
    1. Arendrup M, Hansen JE, Clausen H, Nielsen C, Mathiesen LR, Nielsen JO. Antibody to histo-blood group A antigen neutralizes HIV produced by lymphocytes from blood group A donors but not from blood group B or O donors. AIDS. 1991;5:441–444. - PubMed
    1. Babcock GJ, Esshaki DJ, Thomas WD, Ambrosino DM. Amino acids 270 to 510 of the severe acute respiratory syndrome coronavirus spike protein are required for interaction with receptor. J Virol. 2004;78:4552–4560. - PMC - PubMed
    1. Bara J, Gautier R, Le Pendu J, Oriol R. Immunochemical characterization of mucins. Polypeptide (M1) and polysaccharide (A and Leb) antigens. Biochem J. 1988;254:185–193. - PMC - PubMed
    1. Bureau V, Marionneau S, Cailleau-Thomas A, Le Moullac-Vaydie B, Liehr T, Le Pendu J. Comparison of the three rat GDP-l-fucose:β-d-galactoside 2-α-l-fucosyltransferases FTA, FTB and FTC. Eur J Biochem. 2001;268:1006–1019. - PubMed

Publication types

MeSH terms