Comparative Study
. 2008 Sep 26;4(9):e1000165.
doi: 10.1371/journal.pcbi.1000165.

A genomewide functional network for the laboratory mouse

Affiliations
Comparative Study

A genomewide functional network for the laboratory mouse

Yuanfang Guan et al. PLoS Comput Biol. .

Abstract

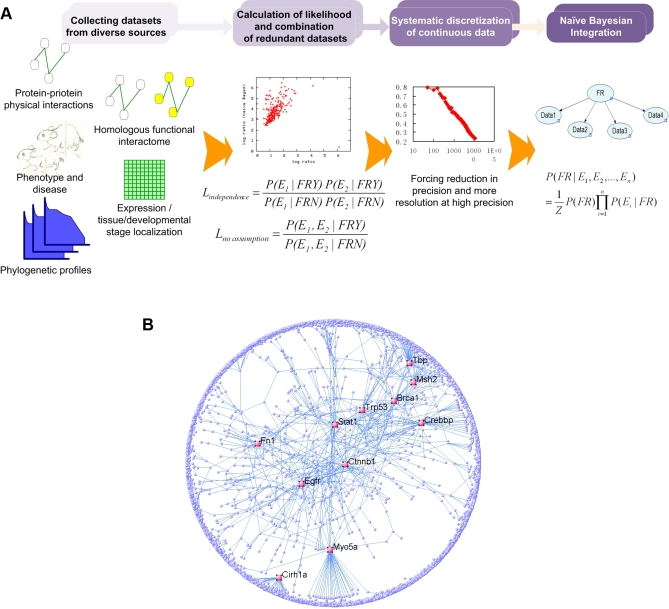
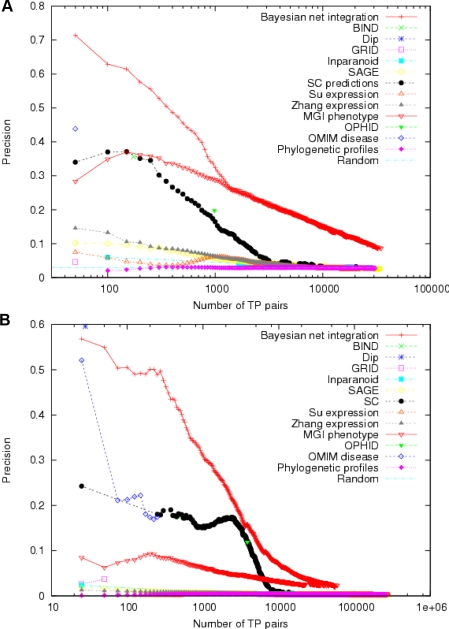
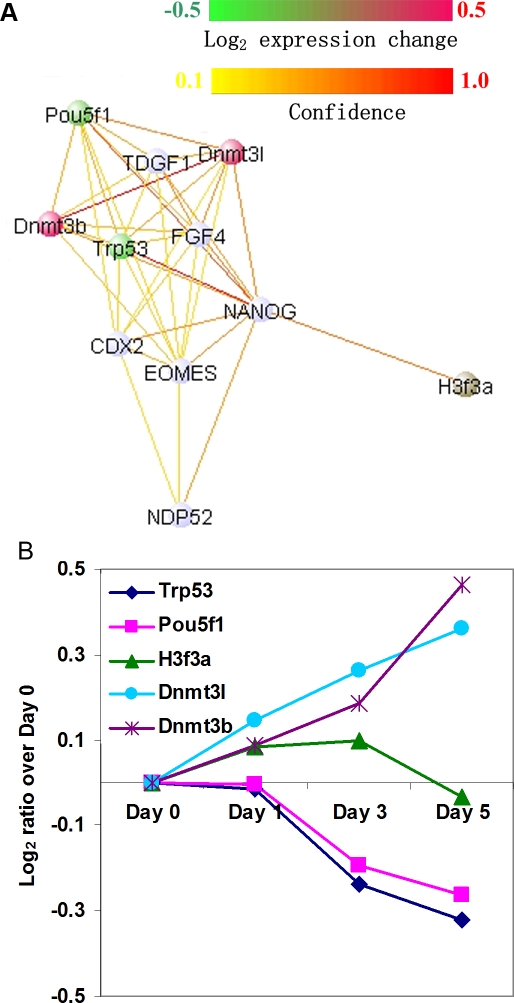
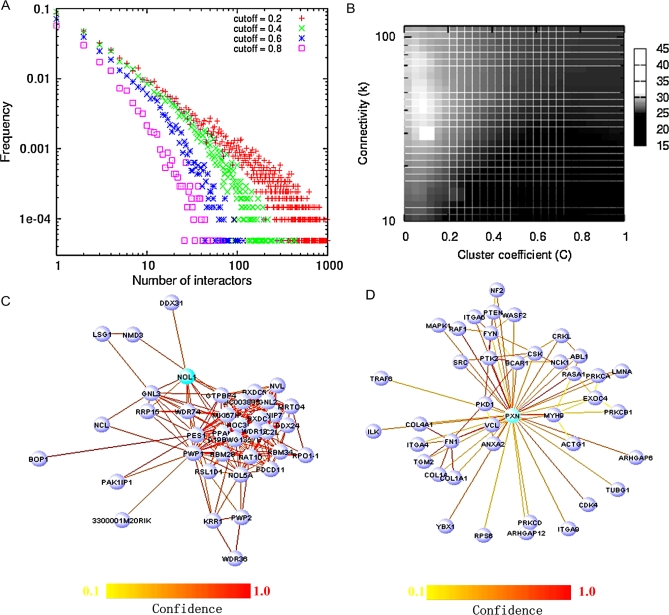
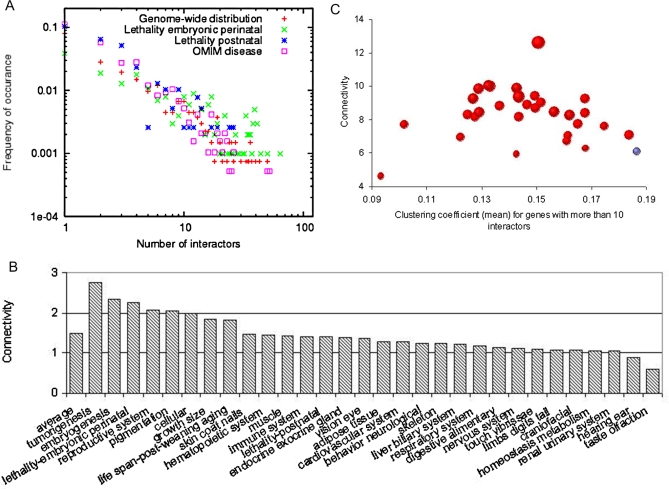
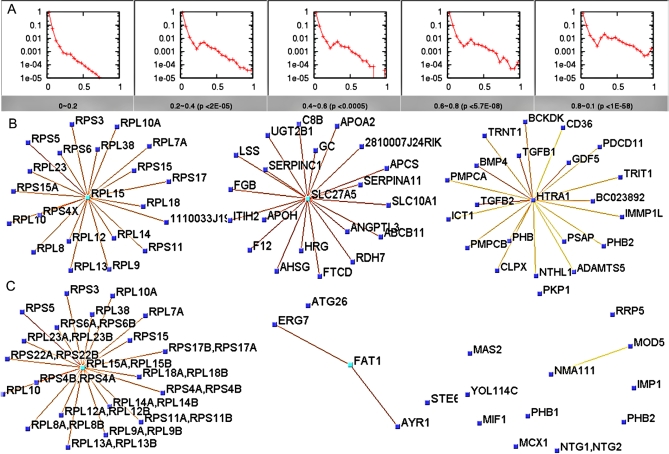
Establishing a functional network is invaluable to our understanding of gene function, pathways, and systems-level properties of an organism and can be a powerful resource in directing targeted experiments. In this study, we present a functional network for the laboratory mouse based on a Bayesian integration of diverse genetic and functional genomic data. The resulting network includes probabilistic functional linkages among 20,581 protein-coding genes. We show that this network can accurately predict novel functional assignments and network components and present experimental evidence for predictions related to Nanog homeobox (Nanog), a critical gene in mouse embryonic stem cell pluripotency. An analysis of the global topology of the mouse functional network reveals multiple biologically relevant systems-level features of the mouse proteome. Specifically, we identify the clustering coefficient as a critical characteristic of central modulators that affect diverse pathways as well as genes associated with different phenotype traits and diseases. In addition, a cross-species comparison of functional interactomes on a genomic scale revealed distinct functional characteristics of conserved neighborhoods as compared to subnetworks specific to higher organisms. Thus, our global functional network for the laboratory mouse provides the community with a key resource for discovering protein functions and novel pathway components as well as a tool for exploring systems-level topological and evolutionary features of cellular interactomes. To facilitate exploration of this network by the biomedical research community, we illustrate its application in function and disease gene discovery through an interactive, Web-based, publicly available interface at http://mouseNET.princeton.edu.


Conflict of interest statement

The authors have declared that no competing interests exist.

Figures

Figure 1
Figure 1. Strategy for processing and integration of diverse genomic data.
(A) Schematic of the network integration pipeline. We collected five different types of data that are indicative of functional relationships, each of which may consist of multiple datasets (Table 1). We assessed the redundancy of each pair of datasets by comparing likelihood ratios with and without the independence assumption; datasets for which these values differed significantly were deemed mutually redundant and combined as a single input node in the Bayesian network for the purposes of integration. Finally, we systematically grouped continuous data and integrated all data with a naïve Bayes classifier to predict pair-wise functional relationships. (B) Global view of the predicted mouse functional network with higher than 0.8 confidence level of linkage. Nodes of high connectivity (more than 20 interactions) are labeled and highlighted in red.
Figure 2
Figure 2. Computational performance analysis of the integrated network to predict functional relationships and the relative performance of different datasets.
(A) Five-fold cross-validation of the integrated results applied to predict gold standard pairs defined by co-annotation to specific GO terms. Positive pairs were defined as those having at least one co-annotation to a specific GO term. Negative pairs are those that have a specific annotation, but share no co-annotations. Precision, or the fraction of correct predictions out of all predictions made, is measured across a number of cutoffs in prediction confidence (higher cutoff allows for less predictions of higher quality, and lowering the cutoff allows more predictions to be made at the cost of some decrease in accruacy). MouseNET predictions always have higher accuracy than those of the individual datasets. (B) Performance of the integrated results when evaluated against a different test set where positives are defined as pairs co-annotated to the same KEGG pathways, and negatives are pairs in which both members are annotated in KEGG, but share no co-annotations. Both performance measurements show that the integrated results are better in recovering known functional relationships than individual datasets.
Figure 3
Figure 3. Analysis of MAPK pathway predictions based on the integrated functional network.
Predictions were derived by iteratively sampling 10 proteins from the known MAPK pathway and finding the closest 40 neighbors based on network adjacency. The results shown are based on an aggregation of 300 such samplings. Bright blue denotes proteins annotated to the canonical MAPK pathway in KEGG. Many of the newly predicted components, although not annotated in KEGG, are supported in the literature (Table S2) and are colored in red. Predictions without literature support are colored in purple. Linkages predicted to be above 0.5 confidence level by our integrated network are shown.
Figure 4
Figure 4. Validation by Nanog down-regulation experiment.
(A) The top 10 neighbors of Nanog as predicted by Bayesian integration. Links with more than 0.1 confidence level are presented in the figure. The colors of Trp53, Dnmt3b, Dnmt3l, Pou5f1, and H3f3a indicate the Log2 changes in protein expression on the fifth day after Nanog knock down compared to day 0. (B) Protein expression changes detected by mass spectrometry after Nanog knock-down. Four of the five top neighbors detected in the nucleus have significant changes in protein expression level, with increasing changes during the time course.
Figure 5
Figure 5. Topological properties of the functional network.
(A) The degree (node connectivity) distribution of the integrated functional network (log10 scale) for several different edge probability cutoffs. (B) Connectivity (at 0.6 cutoff in confidence) versus clustering coefficient. The color represents the number of processes represented in that gene's local network (top 40 neighbors). At the same level of connectivity, proteins with smaller clustering coefficients tend to participate in more processes. Local networks centered around Nol1 (C) and Pxn (D). While both genes have roughly equivalent node degree (∼50 confident connections), a potential modulator of multiple pathways (D), however, is differentiated from other hub genes (such as (C)) in that it has a lower clustering coefficient and thus the network centered at Pxn is less densely connected.
Figure 6
Figure 6. Relationship between phenotypic effects and local network configuration.
(A) Comparison of connectivity (at 0.6 confidence) between essential and non-essential genes, and between genes whose orthologous mutants cause disease in human and those with no apparent phenotype. Both comparisons are based on a functional network excluding any phenotypic or disease input data to avoid circularity, and excluding any datasets involving individual investigation results to avoid investigational biases. (B) The average number of functional interactions (at 0.6 confidence) for genes within each phenotypic class. (C) Based on a functional network from integration of all available data, the clustering coefficient is consistently lower for genes having diverse categories of phenotypes; the size of the bubble is proportional to the number of processes represented in nearest neighbors (40 closest proteins). This trend holds true in a network where all individual investigations are excluded, suggesting this trend is not an effect of investigational bias.
Figure 7
Figure 7. Comparison of yeast and mouse interactome and identification of mouse-specific functional linkages.
(A) Distribution of functional relationships in mouse for the corresponding interaction between orthologous genes in yeast. For each graph, the range of edge confidences in the yeast network is labeled below, and relative frequency (y-axis) is plotted against confidence of functional relationships for orthologous pairs in mouse. The p-value (Mann-Whitney U test) for each sub-figure indicates the significance of the difference between the distribution of mouse functional relationships in that bin and relationships in the range of 0.0–0.2 yeast interaction confidence (the first graph). (B) Subgraphs of mouse interactome centered at Rpl15 (MGI:1913730), ribosomal protein L15; Slc27a5 (MGI:1347100): solute carrier family 27 (fatty acid transporter), member 5; Htra1 (MGI:1929076): HtrA serine peptidase 1. (C) To visualize how interactions in mouse were evolutionarily acquired, we adapted a method of collapsing paralogous genes in the yeast interactome. Yeast orthologs of mouse genes in (B) appear at the same positions in (C). The links represent the average weight of the interactions between paralogs.

References

    1. Jiang T, Keating AE. AVID: an integrative framework for discovering functional relationships among proteins. BMC Bioinformatics. 2005;6:136. - PMC - PubMed
    1. Myers CL, Robson D, Wible A, Hibbs MA, Chiriac C, et al. Discovery of biological networks from diverse functional genomic data. Genome Biol. 2005;6:R114. - PMC - PubMed
    1. Chen Y, Xu D. Global protein function annotation through mining genome-scale data in yeast Saccharomyces cerevisiae. Nucleic Acids Res. 2004;32:6414–6424. - PMC - PubMed
    1. Jansen R, Yu H, Greenbaum D, Kluger Y, Krogan NJ, et al. A Bayesian networks approach for predicting protein-protein interactions from genomic data. Science. 2003;302:449–453. - PubMed
    1. Lee I, Date SV, Adai AT, Marcotte EM. A probabilistic functional network of yeast genes. Science. 2004;306:1555–1558. - PubMed

Publication types

MeSH terms