. 2008 Nov 28;283(48):33240-8.
doi: 10.1074/jbc.M806917200. Epub 2008 Sep 25.

Projection structure of a member of the amino acid/polyamine/organocation transporter superfamily

Affiliations

Projection structure of a member of the amino acid/polyamine/organocation transporter superfamily

Fabio Casagrande et al. J Biol Chem. .

Abstract

The L-arginine/agmatine antiporter AdiC is a key component of the arginine-dependent extreme acid resistance system of Escherichia coli. Phylogenetic analysis indicated that AdiC belongs to the amino acid/polyamine/organocation (APC) transporter superfamily having sequence identities of 15-17% to eukaryotic and human APC transporters. For functional and structural characterization, we cloned, overexpressed, and purified wild-type AdiC and the point mutant AdiC-W293L, which is unable to bind and consequently transport L-arginine. Purified detergent-solubilized AdiC particles were dimeric. Reconstitution experiments yielded two-dimensional crystals of AdiC-W293L diffracting beyond 6 angstroms resolution from which we determined the projection structure at 6.5 angstroms resolution. The projection map showed 10-12 density peaks per monomer and suggested mainly tilted helices with the exception of one distinct perpendicular membrane spanning alpha-helix. Comparison of AdiC-W293L with the projection map of the oxalate/formate antiporter from Oxalobacter formigenes, a member from the major facilitator superfamily, indicated different structures. Thus, two-dimensional crystals of AdiC-W293L yielded the first detailed view of a transport protein from the APC superfamily at sub-nanometer resolution.


Figures

FIGURE 1.
FIGURE 1.
Origin and evolutionary relationship of AdiC with other APC transport proteins. The Bayesian tree shows the position of the AdiC protein sequence (within a box) in the context of other members of the APC transporter superfamily. The abbreviation of each of the subfamilies is on the right side of the tree: see Jack et al. (6) and TCDB Transport Classification Database for a description of each of the subfamilies displayed. The tree was rooted using the MmuP protein of E. coli. Probabilities given by Bayesian analysis are displayed at each of the tree nodes. The bar shows the evolutionary distance in number of expected substitutions per site.
FIGURE 2.
FIGURE 2.
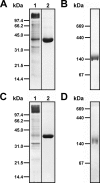
SDS- and BN-PAGE of AdiC and AdiC-W293L. A, 13.5% SDS-PAGE of DDM-solubilized E. coli total membranes containing overexpressed AdiC protein (lane 1) and of purified protein after nickel affinity chromatography (lane 2). AdiC runs as a prominent band at ∼39 kDa in SDS/polyacrylamide gels. B, BN-PAGE of purified AdiC protein in a linear 5–12% gradient gel. C, same as in A, but for AdiC-W293L. D, same as in B, but for AdiC-W293L. All gels were stained with Coomassie Brilliant Blue R-250. Applied amount of protein per lane: ∼9 μg (lane 1, panel A), ∼6 μg (lane 2, panel A), ∼12 μg (panel B), ∼8 μg(lane 1, panel C), ∼5 μg(lane 2, panel C), and ∼5 μg(panel D).
FIGURE 3.
FIGURE 3.
TEM of negatively stained AdiC and AdiC-W293L particles. A, the homogeneity of the purified AdiC protein is reflected in the electron micrograph. Selected top views of AdiC (B) and AdiC-W293L particles (C) are displayed in the corresponding gallery. The scale bar represents 750 Å, and the frame size of the magnified particles in the galleries is 190 Å.
FIGURE 4.
FIGURE 4.
AdiC transport activity. A, time course of l-arginine transport in AdiC proteoliposomes. Influx of 10 μm l-[3H]arginine into AdiC proteoliposomes lacking (open circles) or containing 2 mm l-arginine (closed circles). Data (mean ± S.E.) correspond to a representative experiment with three replicas. Error bars when not visible are smaller than symbols. B, influx of 10 μm l-[3H]arginine into AdiC and AdiC-W293L proteoliposomes. Transport was measured in AdiC proteoliposomes (left) containing no substrate (control), 2 mm l-Arg, or 2 mm agmatine (Agm). Exchange activity in AdiC (wt) and AdiC-W293L (W293L) proteoliposomes (right) was calculated by subtracting transport in the corresponding proteoliposomes with no substrate inside to that in proteoliposomes containing 2 mm l-arginine. Data (mean ± S.E.) correspond to a representative experiment with three replicas. A second experiment gave similar results. C, inhibition pattern of AdiC transport in proteoliposomes. The residual exchange activity of 10 μm l-[3H]arginine (outside) and 2 mm l-arginine (inside) in the presence of the indicated substrate analogs (5 mm) in the external medium is shown. Exchange activity was calculated as in panel B and is expressed as the percentage of transport in AdiC proteoliposomes in the absence of inhibitors. Data are from four to six experiments with three replicates per condition.
FIGURE 5.
FIGURE 5.
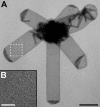
TEM of negatively stained two-dimensional crystals of AdiC-W293L. A, overview electron micrograph of tubular AdiC-W293L crystals. The area marked by the white dashed box was magnified and is displayed in panel B. The scale bars represent 0.6 μm(A) and 0.15 μm(B).
FIGURE 6.
FIGURE 6.
Projection structure of AdiC-W293L. A, p22121-symmetrized projection map of AdiC-W293L at 6.5 Å resolution calculated from five electron micrographs. The black rectangle marks the unit cell (lattice dimensions: a = 184 Å, b = 119 Å, γ = 90°), which contains four AdiC-W293L dimers (two up- and two down-oriented dimers). B, improved projection map of AdiC-W293L after symmetrization of one of the four identical dimers in the unit cell exploiting the internal, non-crystallographic 2-fold symmetry axis of the dimer. The only strong density peak in the projection structure of the AdiC-W293L monomers is marked by arrowheads. The putative intradimeric contact sites are indicated by stars. The 2-fold axes perpendicular to the membrane plane and the screw axes parallel to the membrane plane are indicated. Solid lines indicate density above the mean, whereas negative contours are shown as light gray lines. The scale bar represents 25 Å.
FIGURE 7.
FIGURE 7.
Comparison of the AdiC-W293L and OxlT projection structures. A, projection map of the putative AdiC-W293L monomer at a resolution of 6.5 Å, a member of the APC transporters superfamily. The internal, non-crystallographic 2-fold symmetry axis of the AdiC-W293L dimer is indicated. B, projection map of the OxlT monomer at 6 Å resolution (43), a member of the MFS. Solid lines indicate density above the mean, whereas negative contours are shown as light gray lines. The scale bar represents 10 Å.

References

    1. Donnenberg, M. S. (2000) Nature 406 768-774 - PubMed
    1. Foster, J. W. (2004) Nat. Rev. Microbiol. 2 898-907 - PubMed
    1. Gong, S., Richard, H., and Foster, J. W. (2003) J. Bacteriol. 185 4402-4409 - PMC - PubMed
    1. Iyer, R., Williams, C., and Miller, C. (2003) J. Bacteriol. 185 6556-6561 - PMC - PubMed
    1. Fang, Y., Kolmakova-Partensky, L., and Miller, C. (2007) J. Biol. Chem. 282 176-182 - PubMed

Publication types

MeSH terms

LinkOut - more resources