. 2008 Nov;74(22):7023-35.
doi: 10.1128/AEM.01288-08. Epub 2008 Sep 26.

Bioluminescent Aspergillus fumigatus, a new tool for drug efficiency testing and in vivo monitoring of invasive aspergillosis

Affiliations

Bioluminescent Aspergillus fumigatus, a new tool for drug efficiency testing and in vivo monitoring of invasive aspergillosis

Matthias Brock et al. Appl Environ Microbiol. 2008 Nov.

Abstract

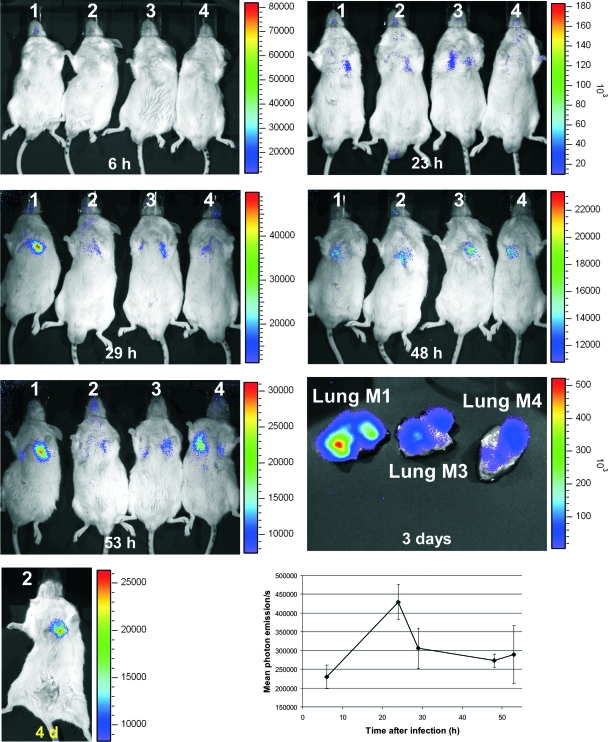
Aspergillus fumigatus is the main cause of invasive aspergillosis in immunocompromised patients, and only a limited number of drugs for treatment are available. A screening method for new antifungal compounds is urgently required, preferably an approach suitable for in vitro and in vivo studies. Bioluminescence imaging is a powerful tool to study the temporal and spatial resolutions of the infection and the effectiveness of antifungal drugs. Here, we describe the construction of a bioluminescent A. fumigatus strain by fusing the promoter of the glyceraldehyde-3-phosphate dehydrogenase gene from A. fumigatus with the luciferase gene from Photinus pyralis to control the expression of the bioluminescent reporter. A. fumigatus transformed with this construct revealed high bioluminescence under all tested growth conditions. Furthermore, light emission correlated with the number of conidia used for inoculation and with the biomass formed after different incubation times. The bioluminescent strains were suitable to study the effectiveness of antifungals in vitro by several independent methods, including the determination of light emission with a microplate reader and the direct visualization of light emission with an IVIS 100 system. Moreover, when glucocorticoid-treated immunosuppressed mice were infected with a bioluminescent strain, light emission was detected from infected lungs, allowing the visualization of the progression of invasive aspergillosis. Therefore, this new bioluminescence tool is suitable to study the in vitro effectiveness of drugs and the disease development, localization, and burden of fungi within tissues and may also provide a powerful tool to study the effectiveness of antifungals in vivo.


Figures

FIG. 1.
FIG. 1.
SDS-polyacrylamide gel electrophoresis showing the purification of recombinant glyceraldehyde-3-phosphate dehydrogenase (GpdA) from A. fumigatus. Lane 1, 25 μg of E. coli crude extract overproducing A. fumigatus GpdA; lane 2, 2.4 μg purified GpdA; lane 3, 3.5 μg purified GpdA; lane M, molecular mass standard. Masses (in kilodaltons) are shown on the left.
FIG. 2.
FIG. 2.
In vitro and in vivo bioluminescence of selected A. fumigatus strains producing firefly luciferase. (A) Digital picture showing light emission from crude extracts of the transformants B2, B4, B8, C8, C5, and C3 after growth on glucose. The parental wild-type strain CBS144.89 and recombinant luciferase (in the range of 5 to 20 μg) with and without (w/o) the addition of wild-type crude extract served as controls. The addition of crude extract slightly quenched the light emission from the luciferase control. (B) Determination of light emission by use of the IVIS 100 system. Different conidium concentrations (1 × 10⁴, 1 × 10⁵, and 1 × 10⁶) of the wild-type strain (WT) and the three transformants C8, C3, and B4 were inoculated in RPMI medium and incubated for 8 h at 37°C. Light emission was induced by the addition of d-luciferin to the medium, and photons were collected for 1 min. (C) Quantification of light emission of wells shown in panel B by use of Living Image software, version 3.0.
FIG. 3.
FIG. 3.
Determination of the relative abundance of transcript levels of gpdA, luc, and citA. cDNA from a glucose-peptone-grown mycelium, incubated for 10, 20, and 30 h, and cDNA from an infected mouse lung were studied. (A) Standardization of the cDNAs against the actin gene act1. Numbers above the cDNA amplification products denote the incubation times (in hours) of the respective strains. Genomic DNA (gDNA) served as the control to visualize the size shift in the cDNA amplification. The fragment sizes were 432 bp for gDNA and 354 bp for cDNA. WT, wild type. (B) Determination of gpdA (G) and citA (C) transcript levels on standardized amounts of cDNA from the wild type and on cDNA from an infected mouse lung. gDNA served as a control. The transcript sizes were 564 bp for gpdA gDNA, 451 bp for gpdA cDNA, 754 bp for citA gDNA, and 575 bp for citA cDNA. Boxed values denote the ratios of band intensities as calculated by trace quantity determinations. The gpdA transcript levels stayed constant, whereas those of citA declined slightly in later growth phases. The gpdA transcript from the infected mouse lung is much more pronounced than that of citA, resembling a late growth phase of the fungus in severe infection. (C) Same as for panel B, but the luciferase-producing strain C3 was studied and the luc gene (L) was included. Fragment sizes for both gDNA and cDNA are identical (688 bp), since the luc gene does not contain an intron. Boxed values denote the ratios of band intensities as calculated by trace quantity determinations. Transcript levels for luc and gpdA stayed constant, whereas that of citA steadily declined. Lane M, molecular size standard. Sizes (in base pairs) are shown on the left.
FIG. 4.
FIG. 4.
Graphical analysis of drug efficiency by luminescence detection. (A) Light emission from wells containing 50,000 conidia of A. fumigatus strain C3 with the addition of different amounts of cycloheximide. Measurements were performed with a microplate reader after 15 h of incubation at 37°C. Standard deviations were calculated from three independent wells for each concentration. A fitted trend line with the corresponding formula and the correlation coefficient is given. (B) Same as for panel A, but nystatin was used as the antifungal drug. (C) Determination of light emission from strain C3 by the IVIS 100 system after growth in the presence of different concentrations of fluconazole. Light emission was detected after 9 and 11 h of incubation in RPMI complete medium at 37°C. Average values from two independent wells are given, and standard deviations are shown by error bars.
FIG. 5.
FIG. 5.
Time-lapse study of luminescence emission from BALB/cJ mice intranasally infected with 2 × 10⁶ conidia of strain C3. All mice displayed luminescence from their lungs 23 h after infection, when d-luciferin was injected intraperitoneally. Luminescence stayed visible until the death of the animals but declined steadily. The lungs from mouse no. 1 (M1), M3, and M4, which were removed postmortem, displayed strong luminescence after the direct injection of d-luciferin. Light emission from live animals was recorded for 5 min, whereas the exposure time for organs ex vivo was set to 1 min. 4 d, 4 days. The lower-right graph shows the mean levels of light emission from the chests of mice as determined by data analysis performed with Living Image software, version 3.0. Standard deviations are shown by error bars.
FIG. 6.
FIG. 6.
Lung histopathology of BALB/cJ mice intranasally infected with the bioluminescent A. fumigatus strain C3. (A and B) Multifocal inflammatory lesion, generally centered on bronchi and bronchioles (arrows) and rarely extending to alveoli and blood vessels (veins and arteries) (arrowheads), characterized by infiltration of karyorrhectic neutrophils (suppuration) and erythrocytes (hemorrhage) (C), destruction of the bronchial/bronchiolar overlying epithelium (necrosis) (C), and the presence of intralesional fungal hyphae (D). These hyphae generally did not cross the bronchiolar wall (arrowheads in panel D). Panels A and C show hematoxylin and eosin staining, and panels B and D show Grocott's methenamine silver staining.

References

    1. Balloy, V., M. Huerre, J. P. Latgé, and M. Chignard. 2005. Differences in patterns of infection and inflammation for corticosteroid treatment and chemotherapy in experimental invasive pulmonary aspergillosis. Infect. Immun. 73:494-503. - PMC - PubMed
    1. Barelle, C. J., C. L. Priest, D. M. Maccallum, N. A. Gow, F. C. Odds, and A. J. Brown. 2006. Niche-specific regulation of central metabolic pathways in a fungal pathogen. Cell. Microbiol. 8:961-971. - PMC - PubMed
    1. Bartlett, J. G. 1993. Anaerobic bacterial infections of the lung and pleural space. Clin. Infect. Dis. 16(Suppl. 4):S248-S255. - PubMed
    1. Bradford, M. M. 1976. A rapid and sensitive method for the quantitation of microgram quantities of protein utilizing the principle of protein-dye binding. Anal. Biochem. 72:248-254. - PubMed
    1. Brenneman, F. N., and W. A. Volk. 1959. Glyceraldehyde phosphate dehydrogenase activity with triphosphopyridine nucleotide and with diphosphopyridine nucleotide. J. Biol. Chem. 234:2443-2447. - PubMed

Publication types

MeSH terms

Associated data