. 2008 Dec 15;112(13):4953-60.
doi: 10.1182/blood-2008-06-163048. Epub 2008 Sep 26.

FOXP3 expression accurately defines the population of intratumoral regulatory T cells that selectively accumulate in metastatic melanoma lesions

Affiliations

FOXP3 expression accurately defines the population of intratumoral regulatory T cells that selectively accumulate in metastatic melanoma lesions

Mojgan Ahmadzadeh et al. Blood. .

Abstract

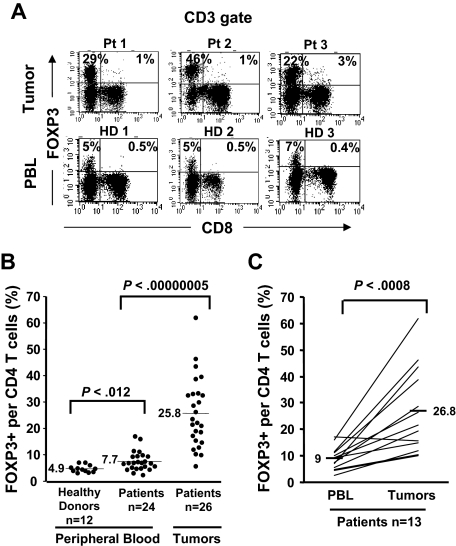
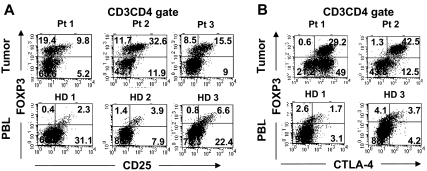
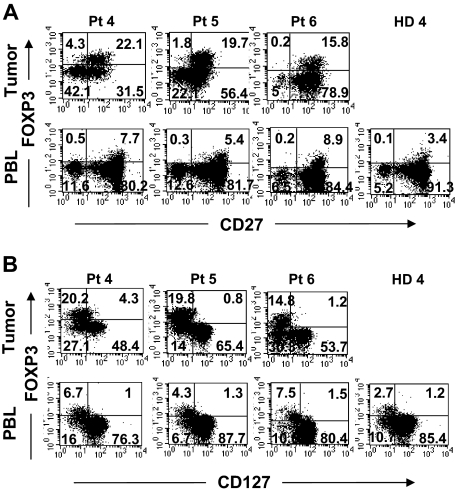
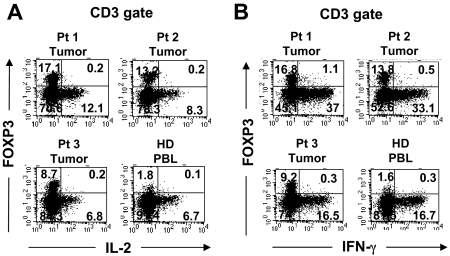
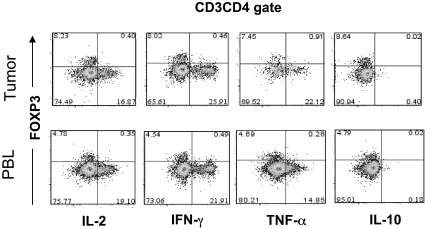
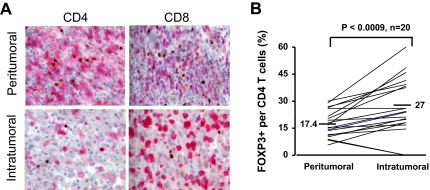
Regulatory T (T(reg)) cells are often found in human tumors; however, their functional characteristics have been difficult to evaluate due to low cell numbers and the inability to adequately distinguish between activated and T(reg) cell populations. Using a novel approach, we examined the intracellular cytokine production capacity of tumor-infiltrating T cells in the single-cell suspensions of enzymatically digested tumors to differentiate T(reg) cells from effector T cells. Similar to T(reg) cells in the peripheral blood of healthy individuals, tumor-infiltrating FOXP3(+)CD4 T cells, unlike FOXP3(-) T cells, were unable to produce IL-2 and IFN-gamma upon ex vivo stimulation, indicating that FOXP3 expression is a valid biological marker for human T(reg) cells even in the tumor microenvironment. Accordingly, we enumerated FOXP3(+)CD4 T(reg) cells in intratumoral and peritumoral sections of metastatic melanoma tumors and found a significant increase in proportion of FOXP3(+)CD4 T(reg) cells in the intratumoral compared with peritumoral areas. Moreover, their frequencies were 3- to 5-fold higher in tumors than in peripheral blood from the same patients or healthy donors, respectively. These findings demonstrate that the tumor-infiltrating CD4 T(reg) cell population is accurately depicted by FOXP3 expression, they selectively accumulate in tumors, and their frequency in peripheral blood does not properly reflect tumor microenvironment.


Figures

Figure 1
Figure 1
Selective accumulation of FOXP3+CD4 T cells in tumors compared with PBLs. Cryopreserved tumor digests from 3 patients with metastatic melanoma (Pt) and PBLs from 3 healthy donors (HD) were thawed and immediately stained with CD3, CD8, and FOXP3 mAbs. (A) The dotplots were gated on CD3+ lymphocytes. The quadrants were set based on the isotype control Abs. The percentage for each quadrant represents the fraction of FOXP3+ T cells in CD8 T cells (top right quadrant) or in CD4 T cells (top left quadrant). CD3+CD8 T cells were considered CD4 T cells throughout the study. (B) The percentage of FOXP3+CD4 T cells per total CD4 T-cell population is quantified in PBLs from healthy donors (n = 12) and from patients with melanoma (n = 24) and in tumor digests (n = 26) using FACS analyses. (C) The percentage of FOXP3+CD4 T cells per total CD4 T cells in PBLs and tumors from the same patients (n = 13) were enumerated as described earlier.
Figure 2
Figure 2
Phenotypic comparison of FOXP3+CD4 T cells in tumors versus peripheral blood in healthy donors. Tumor digests from patients and peripheral blood samples from healthy donors were thawed and immediately stained with anti-CD3, anti-CD8, and anti-FOXP3 mAb along with either (A) anti-CD25 or (B) anti–CTLA-4 mAbs. The dotplots were gated on CD3CD4 (CD3+CD8) T cells. The numbers represent the percentages of CD4 T cells in each quadrant. These results are representative of several independent experiments using tumor digest samples (n = 26) and PBL samples from the same patients (n = 9) and healthy donors (n = 5).
Figure 3
Figure 3
Comparison of surface expression of CD27 and CD127 on FOXP3+CD4 T cells in tumors versus peripheral blood from the same patients. Tumor digests and peripheral blood from patients were thawed and immediately stained with anti-CD3, anti-CD8, and anti-FOXP3 mAb along with either (A) anti-CD27 or (B) anti-CD127 mAbs. The dotplots were gated on CD3CD4 (CD3+CD8) T cells. The numbers represent the percentages of CD4 T cells in each quadrant. These results are representative of multiple independent experiments using tumor digest (n = 19) and PBLs (n = 9) samples from the same patients with metastatic melanoma.
Figure 4
Figure 4
Functional comparison of FOXP3+CD4 T cells in tumors versus peripheral blood. Tumor digests from patients and peripheral blood samples from healthy donors were thawed and immediately stimulated with PMA/I for 6 to 8 hours in the presence of monensin. Cells were subsequently stained with anti-CD3, anti-CD8, and anti-FOXP3 mAb along with either (A) anti–IL-2 or (B) anti–IFN-γ mAbs. The dotplots were gated on CD3+ T cells. The numbers represent the percentages of T cells in each quadrant. These results are representative of multiple independent experiments using tumor digest samples from different patients (n = 26) and PBL samples from healthy donors (n = 3) and the same patients (n = 5; Figure 5).
Figure 5
Figure 5
Functional comparison of FOXP3+CD4 T cells in tumor versus peripheral blood in the same patient. Tumor digests and peripheral blood samples from patients with metastatic melanoma were thawed and immediately stimulated with PMA/I for 6 to 8 hours in the presence of monensin. Cells were subsequently stained with anti-CD3, anti-CD8, and anti-FOXP3 mAb along with anti–IL-2, anti–IFN-γ, anti–TNF-α, or anti–IL-10 mAbs. The dotplots were gated on CD3CD4 (CD3+CD8) T cells. The numbers represent the percentages of CD4 T cells in each quadrant. These results are representative of multiple independent experiments using tumor digest samples from different patients (n = 8) and PBL samples from the same patients (n = 5).
Figure 6
Figure 6
Enumerating FOXP3+ T cells within peritumoral and intratumoral sections using immunohistochemical analysis. Metastatic melanoma lesions from 20 patients were analyzed by immunhistochemistry to enumerate the number of FOXP3+ T cells in the intratumoral and peritumoral (stromal) areas in metastatic melanoma tumors. (A) CD4 (first column) and CD8 (second column) were visualized in pink and FOXP3 staining of nucleus was depicted in brown; ×40 magnification was used. (B) The percentage of FOXP3+CD4 T cells per total CD4 T-cell population in the intratumoral and peritumoral sections were calculated for each patient. The paired t test was used to compare between intratumoral and peritumoral sections.

Similar articles

Cited by

References

    1. Baecher-Allan C, Viglietta V, Hafler DA. Human CD4+CD25+ regulatory T cells. Semin Immunol. 2004;16:89–98. - PubMed
    1. Sakaguchi S. Naturally arising CD4+ regulatory T cells for immunologic self-tolerance and negative control of immune responses. Annu Rev Immunol. 2004;22:531–562. - PubMed
    1. Hori S, Nomura T, Sakaguchi S. Control of regulatory T cell development by the transcription factor Foxp3. Science. 2003;299:1057–1061. - PubMed
    1. Fontenot JD, Rudensky AY. A well adapted regulatory contrivance: regulatory T cell development and the forkhead family transcription factor Foxp3. Nat Immunol. 2005;6:331–337. - PubMed
    1. Ziegler SF. FOXP3: of mice and men. Annu Rev Immunol. 2006;24:209–226. - PubMed

MeSH terms