. 2008 Dec 15;95(12):5606-17.
doi: 10.1529/biophysj.108.135442. Epub 2008 Sep 26.

Ensemble modeling of metabolic networks

Affiliations

Ensemble modeling of metabolic networks

Linh M Tran et al. Biophys J. .

Abstract

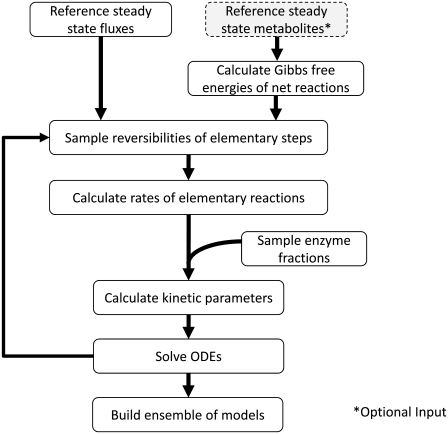
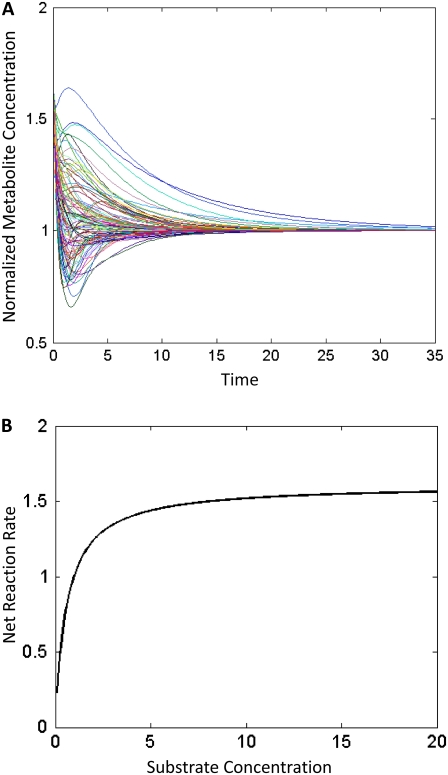
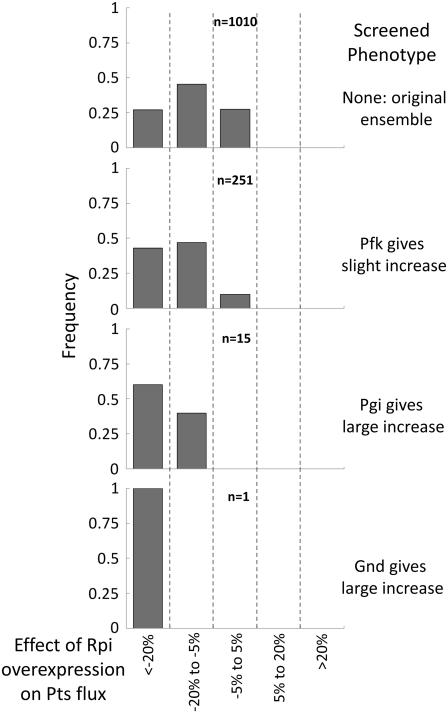
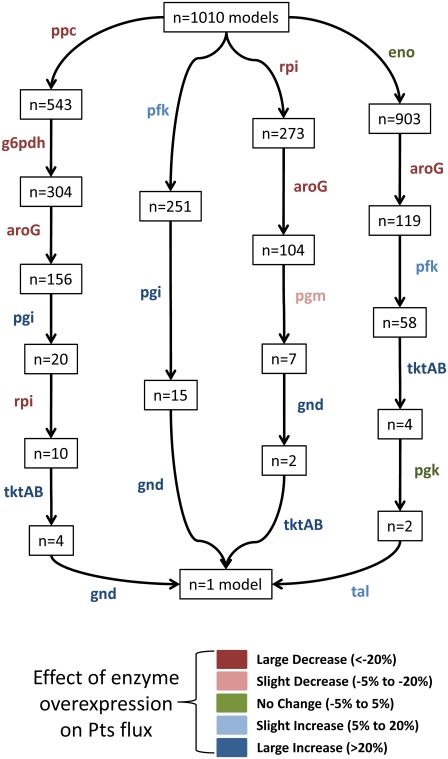
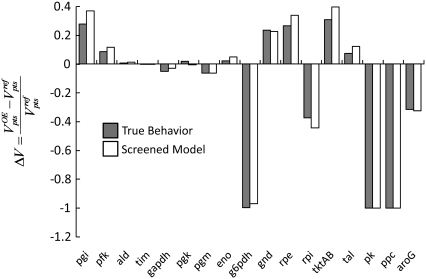
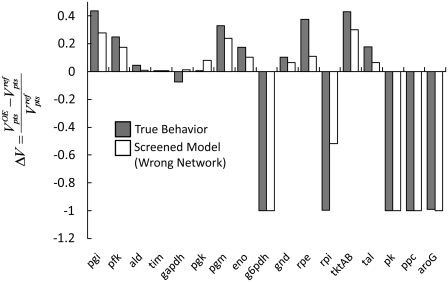
Complete modeling of metabolic networks is desirable, but it is difficult to accomplish because of the lack of kinetics. As a step toward this goal, we have developed an approach to build an ensemble of dynamic models that reach the same steady state. The models in the ensemble are based on the same mechanistic framework at the elementary reaction level, including known regulations, and span the space of all kinetics allowable by thermodynamics. This ensemble allows for the examination of possible phenotypes of the network upon perturbations, such as changes in enzyme expression levels. The size of the ensemble is reduced by acquiring data for such perturbation phenotypes. If the mechanistic framework is approximately accurate, the ensemble converges to a smaller set of models and becomes more predictive. This approach bypasses the need for detailed characterization of kinetic parameters and arrives at a set of models that describes relevant phenotypes upon enzyme perturbations.


Figures

FIGURE 1
FIGURE 1
Algorithm used by the ensemble modeling framework. Note the concentrations of the metabolites at steady state are an optional input into the method.
FIGURE 2
FIGURE 2
(A) Example of the behavior of different models within an ensemble. All models reach the same given steady state, but all have different kinetics and thus much different dynamic behavior. Each curve represents the transient metabolite concentrations of the same metabolite from 100 models within the ensemble. The y axis is the metabolite's concentration normalized by its steady-state concentration. The time courses are generated using the network described in Fig. 3. (B) A demonstration of the elementary reaction kinetics exhibiting saturation behavior. For a single reaction, as the substrate concentration is increased, the net reaction rate reaches a maximum saturated value.
FIGURE 3
FIGURE 3
Metabolic network of central metabolism used to test the methodology. Enzyme names are shown in italics. Metabolites are in all caps. Inhibitors are shown in gray octagons.
FIGURE 4
FIGURE 4
Example of how the enzymatic reactions are broken down into their elementary mechanistic reactions for the phosphotransferase system (Pts) and phosphoglucose isomerase (Pgi).
FIGURE 5
FIGURE 5
Phenotypes of the twofold overexpression of each enzyme on the glucose uptake (Pts flux). Values are expressed as the fraction of the total number of models (n) that exhibit that phenotype. No change (green bars) indicates a change of <5% in either direction. A slight increase (light blue bars)/decrease (pink bars) indicates a change in Pts flux of between 5% and 20%. A large increase (dark blue bars)/decrease (red bars) indicates a change in Pts flux of >20%. The enzyme used for screening in each step is underscored in red. (A) The unscreened ensemble of 1010 models. (B) The screened ensemble of 251 models when Pfk is overexpressed shows a slight increase in Pts flux. (C) The second-level screening when Pgi is overexpressed gives a significant increase in Pts flux (15 models). (D) The third-level screening when Gnd is overexpressed gives a large increase in Pts flux (one model).
FIGURE 6
FIGURE 6
Individual view of the phenotypes for the Rpi enzymatic reaction over the same screening steps shown in Fig. 5. As the ensemble of models is screened and converges, the distribution of possible dynamic phenotypes for Rpi also converges.
FIGURE 7
FIGURE 7
Overexpression phenotypes chosen to screen the ensemble all converge to the same model, albeit in a different number of steps, indicating that the screening strategy is robust to the path chosen. Enzymes used for screening each step are indicated next to the appropriate arrow, and are color-coded according to their overexpression phenotype.
FIGURE 8
FIGURE 8
Comparison of the behavior of the “true” model based on individual Michaelis-Menten kinetics and the one model screened out in Fig. 5. The influence of each enzyme's twofold overexpression on the PTS flux is very similar between the true model and the model obtained through our screening strategy.
FIGURE 9
FIGURE 9
Comparison of the behavior of the Michaelis-Menten model used as the true system and the models screened using a network with inconsistent regulatory connections. In this case, we remove the feedback inhibition of PEP on the Pfk flux in the ensemble network. Even with the inconsistent regulatory pattern between models, we see a similar behavior when each enzyme is overexpressed twofold. However, when PGI is overexpressed, we see a difference in model behavior directly upstream of the missing regulatory feature of PEP as an inhibitor to Pfk.
FIGURE 10
FIGURE 10
Histogram of log10(Km/X) values for the glycolysis model system, where X is the steady-state metabolite concentration for the corresponding metabolite. Km values range from severalfold below the steady-state metabolite concentrations to severalfold above the metabolite concentrations, indicating that the kinetics within our system range from saturation to linear behavior.

References

    1. Lee, D. Y., C. Yun, A. Cho, B. K. Hou, S. Park, and S. Y. Lee. 2006. WebCell: a web-based environment for kinetic modeling and dynamic simulation of cellular networks. Bioinformatics. 22:1150–1151. - PubMed
    1. Segrè, D., J. Zucker, J. Katz, X. Lin, P. D'Haeseleer, W. P. Rindone, P. Kharchenko, D. H. Nguyen, M. A. Wright, and G. M. Church. 2003. From annotated genomes to metabolic flux models and kinetic parameter fitting. OMICS. 7:301–316. - PubMed
    1. Wang, L., I. Birol, and V. Hatzimanikatis. 2004. Metabolic control analysis under uncertainty: framework development and case studies. Biophys. J. 87:3750–3763. - PMC - PubMed
    1. Chassagnole, C., N. Noisommit-Rizzi, J. W. Schmid, K. Mauch, and M. Reuss. 2002. Dynamic modeling of the central carbon metabolism of Escherichia coli. Biotechnol. Bioeng. 79:53–73. - PubMed
    1. Savageau, M. A. 1969. Biochemical systems analysis. I. Some mathematical properties of the rate law for the component enzyme reactions. J. Theor. Biol. 25:365–369. - PubMed

Publication types