. 2009 Jun;19(6):1273-93.
doi: 10.1093/cercor/bhn167. Epub 2008 Sep 26.

Molecular regulation of DNA damage-induced apoptosis in neurons of cerebral cortex

Affiliations

Molecular regulation of DNA damage-induced apoptosis in neurons of cerebral cortex

Lee J Martin et al. Cereb Cortex. 2009 Jun.

Abstract

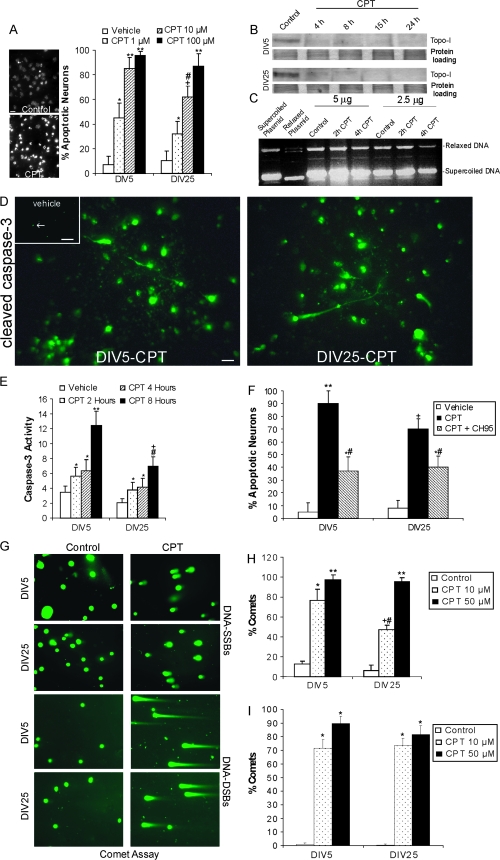
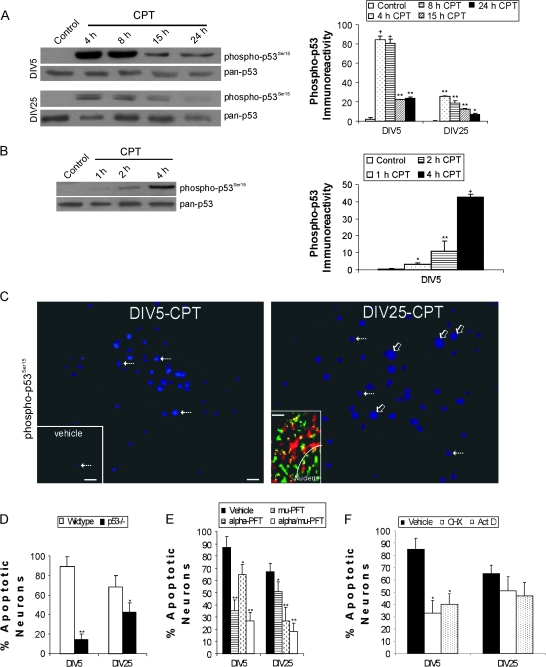
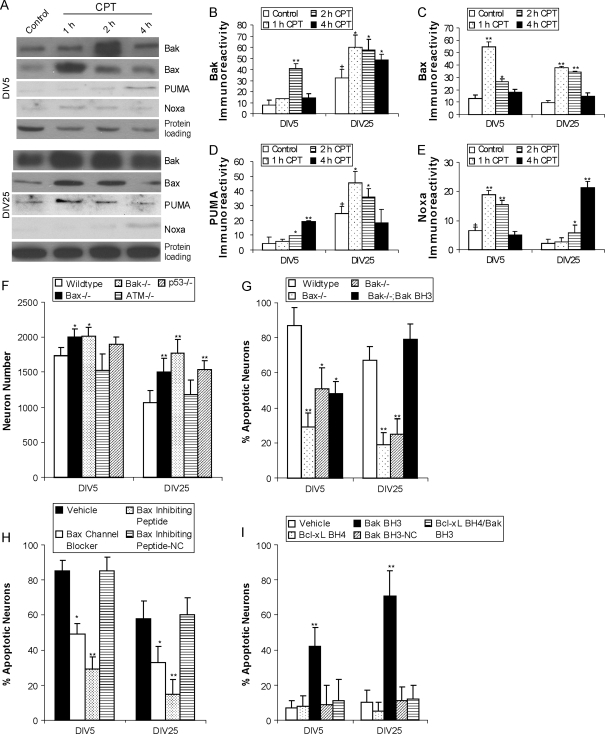
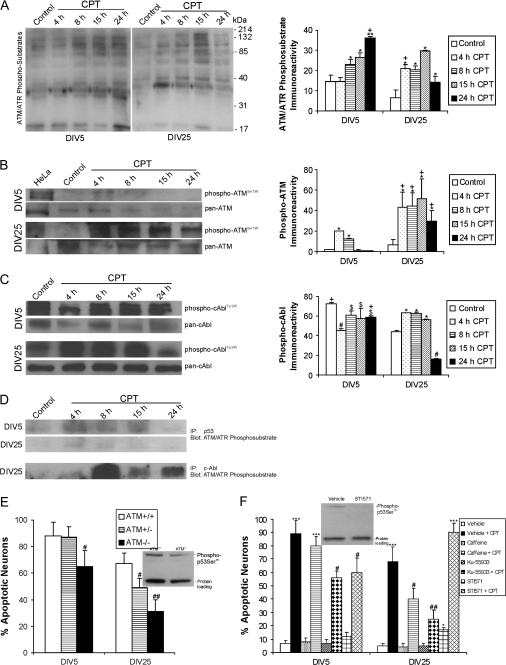
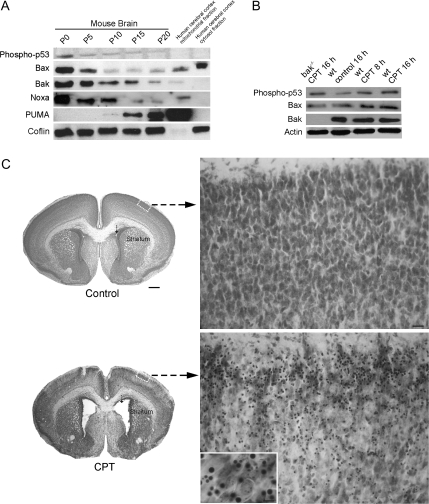
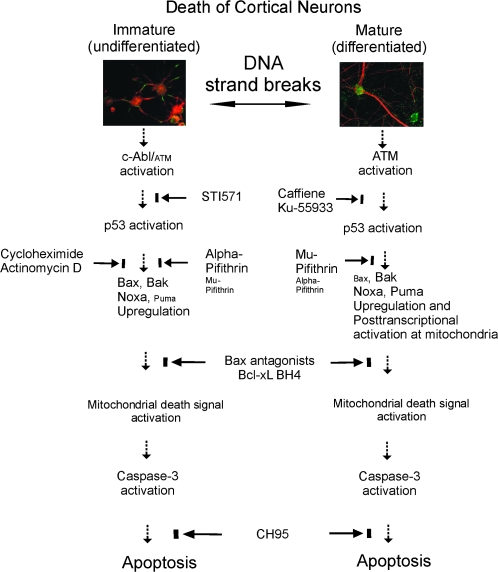
Cerebral cortical neuron degeneration occurs in brain disorders manifesting throughout life, but the mechanisms are understood poorly. We used cultured embryonic mouse cortical neurons and an in vivo mouse model to study mechanisms of DNA damaged-induced apoptosis in immature and differentiated neurons. p53 drives apoptosis of immature and differentiated cortical neurons through its rapid and prominent activation stimulated by DNA strand breaks induced by topoisomerase-I and -II inhibition. Blocking p53-DNA transactivation with alpha-pifithrin protects immature neurons; blocking p53-mitochondrial functions with mu-pifithrin protects differentiated neurons. Mitochondrial death proteins are upregulated in apoptotic immature and differentiated neurons and have nonredundant proapoptotic functions; Bak is more dominant than Bax in differentiated neurons. p53 phosphorylation is mediated by ataxia telangiectasia mutated (ATM) kinase. ATM inactivation is antiapoptotic, particularly in differentiated neurons, whereas inhibition of c-Abl protects immature neurons but not differentiated neurons. Cell death protein expression patterns in mouse forebrain are mostly similar to cultured neurons. DNA damage induces prominent p53 activation and apoptosis in cerebral cortex in vivo. Thus, DNA strand breaks in cortical neurons induce rapid p53-mediated apoptosis through actions of upstream ATM and c-Abl kinases and downstream mitochondrial death proteins. This molecular network operates through variations depending on neuron maturity.


Figures

Figure 1.
Figure 1.
CPT causes in cortical neurons inactivation of Topo-I, accumulation of DNA-SSBs and -DSBs in neurons, and induces caspase 3–dependent apoptosis. (A) Hoechst 33258 staining of DIV5 neuron nuclei in vehicle control and 10 μM CPT-treated cells. There are few apoptotic neurons (nuclei that are bright white and condensed into single or multiple round aggregates) in controls, whereas most neurons are apoptotic after 24 h of CPT exposure. Scale bar = 7 μm. Graph shows that the amount of apoptosis is dose-dependent in DIV5 (immature) and DIV25 (mature-differentiated) neurons. Values are mean ± SD based on at least 6 images of Hoechst-stained cells per group. Results were replicated in 3 different cell culture experiments. Symbols denote: significantly greater *P < 0.01, **P < 0.001, and +P < 0.005 versus vehicle; significantly lower #P < 0.05 versus concentration-matched DIV5 neurons. (B) Western blots showing rapid and dramatic loss of Topo-I protein with 10 μM CPT treatment for 4 through 24 h in DIV5 and DIV25 neurons. Ponceau S staining of nitrocellulose membrane shows protein loading. (C) Plasmid DNA-based Topo-I activity assay on DIV5 neuron extracts showing decreased formation of DNA topoisomers (relaxed DNA) from supercoiled DNA at 4 h of 10 μM CPT exposure. Results were confirmed using 2 amounts of total protein (2.5 and 5 μg). (D) Cleaved caspase-3 immunoreactivity (Alexa-488 green labeling) accumulates robustly by 8 h of CPT treatment in most DIV5 and DIV25 cortical neurons. Scale bar = 10 μm. Only a few isolated neurons are positive for cleaved caspase-3 in vehicle control cultures (upper left inset, green dots, see arrow). Inset scale bar = 80 μm. (E) Capase-3 activity, determined by biochemical colorimetric assay, is increased in DIV5 and DIV25 cortical neurons in a time-related manner after 10 μM CPT exposure. Values (in units × 10−1) are mean ± SD (n = 3 different cultures of 6 pooled 35 mm wells per data point). Significantly greater *P < 0.05, **P < 0.001 and +P < 0.01 versus vehicle; significantly lower #P < 0.01 versus timed-matched DIV5 neurons. (F) Inhibition of apoptosis induced by 10 μM CPT in both DIV5 and DIV25 neurons with the small-molecule nonpeptide caspase-3 inhibitor CH95. Values are mean ± SD based on at least 6 images of Hoechst-stained cells per group and were replicated in 3 different culture experiments. Symbols denote: significantly greater *P < 0.01, **P < 0.001 and +P < 0.005 versus vehicle; significantly lower #P < 0.05 versus CPT treatment alone. (G) Alkaline and neutral comet assays show accumulation of DNA-SSBs and DNA-DSBs in immature DIV5 neurons and mature DIV25 neurons after 4 h exposure to 10 μM CPT. DNA is stained with SYBR Green. Few control neurons have comet tails. Most CPT-treated neurons have comet tails indicating DNA-SSBs or -DSBs. (H) Quantification of the percentage of DIV5 and DIV25 neurons with DNA-SSBs after 4 h exposure to 10 μM or 50 μM CPT as determined by alkaline comet assay. Values are mean ± SD based on at least 10 images per group and were replicated in 2 different culture experiments and comet assays. Symbols denote: significantly greater *P < 0.005, **P < 0.001, and +P < 0.01 versus vehicle; significantly lower #P < 0.01 versus concentration-matched DIV5 neurons. (I) Quantification of the percentage of DIV5 and DIV25 neurons with DNA-DSBs after 4 h exposure to 10 or 50 μM CPT as determine by neutral comet assay. Values are mean ± SD derived from at least 10 images per group and were replicated in 2 different culture experiments and comet assays. Symbols denote: significantly greater *P < 0.001 than control.
Figure 2.
Figure 2.
p53 regulates DNA damage-induced apoptosis in immature and mature cortical neurons through partly different mechanisms. (A) Western blots showing robust activation of p53 through phosphorylation of serine-15 (detected with phosphorylation state-specific antibody) with 10 μM CPT treatment for 4 through 24 h (h) in DIV5 and DIV25 neurons (10 μg total protein loaded per lane). Total levels of p53 (detected with a phosphorylation state-independent pan antibody) remain stable or decrease over time. Graph shows the optical density measurements of phospho-p53 (in relative OD units) in DIV5 (immature) and DIV25 (mature-differentiated) neurons with 10 μM CPT treatment. Values are mean ± SD (n = 3 different cultures of 6 pooled 35 mm wells per data point). Symbols denote: significantly greater +P < 0.0001, **P < 0.001, and **P < 0.01 versus vehicle. (B) Western blot showing rapid activation of p53 by phosphorylation of serine-15 (detected with phosphorylation state-specific antibody) with 10 μM CPT treatment for 1 through 4 h in DIV5 neurons (7 μg total protein loaded per lane). Total levels of p53 (detected with a phosphorylation state-independent pan antibody) remain stable over this time course. Graph shows the optical density measurements of phospho-p53 (in relative OD units) in DIV5 neurons with 10 μM CPT treatment. Values are mean ± SD (n = 3 different cultures of 6 pooled 35 mm wells per data point). Symbols denote: significantly greater +P < 0.001, **P < 0.01, and *P < 0.05 versus vehicle. (C) Phospho-p53 immunoreactivity (cascade blue labeling) is present robustly at 4 h of CPT treatment in many DIV5 and DIV25 cortical neurons. In DIV5 neurons treated with CPT, phospho-p53 immunoreactivity is confined mostly to the nucleus (hatched arrows) in positive cells. In DIV25 neurons treated with CPT, phospho-p53 immunoreactivity is present throughout the cell body (nucleus and cytoplasm) in many neurons (open arrows), but in some neurons in the same microscopic field p53 immunoreactivity is confined to the nucleus (hatched arrows). Note that nuclei with p53 staining (hatched arrows) in DIV5 and DIV25 neurons have similar sizes, whereas the neurons with both cytoplasmic and nuclear labeling in DIV25 cultures are larger because the entire cell body is labeled. Scale bar in DIV5-CPT image = 10 μm (same bar for DIV-25 image). Only a few nuclei are positive for phospho-p53 (blue labeling) in vehicle control cultures (lower left inset, hatched arrow). Vehicle inset scale bar = 80 μm. Immunocytochemical dual labeling (lower left inset in right panel) for phospho-p53 (green) and the mitochondrial marker manganese superoxide dismutase (red) reveals a mitochondrial localization for some p53 (seen as yellow) in CPT-treated DIV25 neurons. The white curved line delineates partially the border between the nucleus and the cytoplasm (inset scale bar = 0.5 μm). (D) p53 gene deletion reduces apoptosis in DIV5 and DIV25 cortical neurons treated with CPT for 24 h. Values are mean ± SD based on at least 6 images of Hoechst-stained neurons per group and were replicated in 3 different culture experiments. Symbols denote: significantly lower **P < 0.001 and *P < 0.01 versus wild-type neurons. (E) Pharmacological inactivation of p53 reduces apoptosis in immature and mature wild-type cortical neurons. Neurons were treated (10 μM) with cyclic-α-pifithrin (α-PFT) that blocks reversibly p53-dependent transactivation of p53-dependent responsive genes, μ-PFT that blocks p53 interaction with Bcl-xL and Bcl-2 and inhibits selectively p53 translocation to mitochondria without affecting the transactivation function of p53, or a combination of both drugs for 2 h before exposure to 10 μM CPT. At 24 h, neurons were assessed for apoptosis. Values are mean ± SD based on at least 6 images of Hoechst-stained neurons per group and were replicated in 3 different culture experiments. Symbols denote: significantly lower **P < 0.001 and *P < 0.05 versus vehicle-treated neurons. (F) CPT-induced apoptosis of immature cortical neurons (but not mature cortical neurons) is transcriptionally and translationally dependent. Neurons were treated with the protein synthesis inhibitor cycloheximide (1 μg/ml) or the RNA synthesis inhibitor actinomycin D (1 μg/ml) for 2 h before exposure to 10 μM CPT. At 24 h, neurons were assessed for apoptosis. Values are mean ± SD based on at least 6 images of Hoechst-stained neurons per group and were replicated in 2 different culture experiments. Symbol denotes significantly lower *P < 0.001 versus vehicle-treated neurons.
Figure 3.
Figure 3.
Effectors of cell death downstream of p53 are regulated differentially and have different contributions in the mechanisms of apoptosis in immature and mature cortical neurons. (A) Western blots showing rapid changes in the levels of multidomain (Bax and Bak) and BH3-only (Noxa and Puma) cell death proteins with 10 μM CPT treatment for 1 through 4 h in DIV5 and DIV25 neurons. GAPDH blot shows protein loading. (B) Graph of Bak levels (in relative OD units) in DIV5 and DIV25 neurons with 10 μM CPT treatments for 1 through 4 h. Values are mean ± SD (n = 3 different cultures of 6 pooled 35 mm wells per data point). Symbols denote: significantly higher **P < 0.001 and *P < 0.01 versus age-matched vehicle-treated neurons; significantly greater +P < 0.01 versus DIV5 vehicle-treated neurons. (C) Graph of Bax levels (in relative OD units) in DIV5 and DIV25 neurons with 10 μM CPT treatments for 1 through 4 h. Values are mean ± SD (n = 3 different cultures of 6 pooled 35 mm wells per data point). Symbols denote: significantly higher **P < 0.001 and *P < 0.01 versus age-matched vehicle. (D) Graph of Puma levels (in relative OD units) in DIV5 and DIV25 neurons with 10 μM CPT treatments for 1 through 4 h. Values are mean ± SD (n = 3 different cultures of 6 pooled 35 mm wells per data point). Symbols denote: significantly higher **P < 0.01 and *P < 0.05 versus age-matched vehicle; significantly greater +P < 0.01 versus DIV5 vehicle-treated neurons. (E) Graph of Noxa levels (in relative OD units) in DIV5 and DIV25 neurons with 10 μM CPT treatments for 1 through 4 h. Values are mean ± SD (n = 3 different cultures of 6 pooled 35 mm wells per data point). Symbols denote: significantly higher **P < 0.001 and *P < 0.05 versus age-matched vehicle; significantly greater +P < 0.05 versus DIV25 vehicle-treated neurons. (F) Graph of the survival (neuron number/mm2) of genetically distinct mouse cortical neurons with homozygous deletion of Bax, Bak, ATM, or p53 genes compared with wild-type neurons. Neurons were plated at identical densities, maintained identically in culture, and then assessed for survival at DIV5 and DIV25 using phase contrast imaging. Values are mean ± SD based on at least 6 images per group and were replicated in 2 different culture experiments. Symbols denote: significantly higher *P < 0.05 and **P < 0.01 versus age-matched wild-type neurons. (G) Homozygous deletion of Bax or Bak genes protect against apoptosis in mouse cortical neurons treated with CPT for 24 h at DIV5 and DIV25. Apoptosis was reconstituted in Bak−/− mouse cortical neurons by treatment (20 μM) with a cell-permeable Bak-BH3 domain peptide. Mutated Bak-BH3 peptide (negative control, NC) had no apoptotic activity in cortical neurons (see panel I). Values are mean ± SD based on at least 6 images of Hoechst-stained neurons per group and were replicated in 3 different culture experiments. Symbols denote: significantly lower **P < 0.001 and *P < 0.01 versus wild-type neurons. (H) Neuroprotection in wild-type mouse cortical neurons by pharmacological manipulation of Bax function. Pretreatment (20 μM) of DIV5 and DIV25 cortical neurons with a cell-permeable Bax-channel blocker (dibromocarbazole-piperazinyl derivative) or a Bax-inhibiting pentapeptide derived from the Ku70-Bax inhibiting domain effectively blocks CPT-induced apoptosis. A mutated analog of Bax-inhibiting pentapeptide did not block apoptosis of cortical neurons. Values are mean ± SD based on at least 6 images of Hoechst-stained neurons per group and were replicated in 3 different culture experiments. Symbols denote: significantly lower **P < 0.001 and *P < 0.01 versus vehicle-treated neurons exposed to 10 μM CPT. (I) Neuroprotection in wild-type mouse cortical neurons using an antiapoptotic BH4 domain peptide. Pretreatment (10 μM) with a peptide containing the Bcl-XL-BH4 domain linked to a 10 amino acid HIV-TAT carrier peptide (Bcl-XL-BH4 peptide) completely blocked Bak-BH3 peptide-induced (20 μM) apoptosis. Values are mean ± SD based on at least 6 images of Hoechst-stained neurons per group and were replicated in 3 different culture experiments. Symbols denote: significantly higher **P < 0.001 than all other treatment groups.
Figure 4.
Figure 4.
DNA damage response kinases drive CPT-induced p53-mediated apoptosis in immature and mature cortical neurons. A. Western blots show activation of ATM/ATR kinase (by detection of phosphorylated substrate proteins) after CPT treatment (10 μM) for 4 through 24 h (h) in DIV5 and DIV25 neurons. Graph of ATM/ATR phosphosubstrate immunoreactivity (in relative OD units) in DIV5 (immature) and DIV25 (mature-differentiated) neurons with 10 μM CPT treatment. Values are mean ± SD (n = 3 different cultures of 6 pooled 35 mm wells per data point). Symbols denote: significantly greater **P < 0.001 and **P < 0.01 versus age-matched vehicle; significantly greater +P < 0.01 versus time-matched CPT-treated neurons. (B) Western blots show robust activation of ATM through phosphorylation of serine-1981 (detected with phosphorylation state-specific antibody) after 10 μM CPT treatment for 4 through 24 h in DIV5 and DIV25 neurons. Total levels of ATM (detected with a phosphorylation state-independent pan antibody) decrease over time. γ-Irradiated HeLa cells are a positive control for DNA damaged-induced activation of ATM. Graph of phospho-ATM levels (in relative OD units) in DIV5 (immature) and DIV25 (mature-differentiated) neurons with 10 μM CPT treatment. Values are mean ± SD (n = 3 different cultures of 6 pooled 35 mm wells per data point). Symbols denote: significantly greater *P < 0.01 versus age-matched vehicle; significantly greater +P < 0.05 than time-matched DIV5 neurons. (C) Western blots for activated tyrosine-245-phosphorylated c-Abl (detected with phosphorylation state-specific antibody) and total c-Abl (detected with a phosphorylation state-independent pan antibody) with 10 μM CPT treatment for 4 through 24 h (h) in DIV5 and DIV25 neurons. Graph of phospho-cAbl levels (in relative OD units) in DIV5 (immature) and DIV25 (mature-differentiated) neurons with 10 μM CPT treatment. Values are mean ± SD (n = 3 different cultures of 6 pooled 35 mm wells per data point). Symbols denote: significantly lower #P < 0.001 and $P < 0.05 versus age-matched vehicle-treated neurons; significantly greater *P < 0.01 versus age-matched vehicle-treated neurons; significantly greater +P < 0.01 than time-matched DIV25 neurons. (D) Immunoprecipitation assay identifying p53 and c-Abl as direct ATM/ATR targets in cortical neurons undergoing apoptosis induced by CPT. Results were confirmed in 3 different experiments. (E) ATM gene deletion provides significant protection against apoptosis in DIV5 and DIV25 cortical neurons treated with CPT for 24 h. Values are mean ± SD based on at least 6 images of Hoechst-stained neurons per group and were replicated in 3 different culture experiments. Symbols denote: significantly lower #P < 0.05 and ##P < 0.01 versus wild-type neurons. Western blot shows that ATM gene deletion attenuates p53 activation. (F) Pharmacological inactivation of ATM and c-Abl protects against apoptosis in immature and mature wild-type cortical neurons. Neurons were treated with highly specific (Ku-55933, 10 μM) or less specific (caffeine, 100 μM) ATM inhibitors or the c-Abl inhibitor (STI571, 10 μM) for 2 h before exposure to 10 μM CPT. At 24 h, the neurons were assessed for apoptosis. Values are mean ± SD derived from at least 6 images of Hoechst-stained neurons per group and were replicated in 3 different culture experiments. Symbols denote: significantly higher ***P < 0.001 and *P < 0.05 versus age-matched vehicle-treated neurons; significantly lower #P < 0.01 and ##P < 0.001 versus age-matched CPT/vehicle-treated neurons. Western blotting shows that p53 activation is attenuated by c-Abl inhibition. ATM inhibition also attenuated p53 activation (data not shown).
Figure 5.
Figure 5.
Low-dose CPT and an alternative DNA-damaging agent, ETOP, induce apoptosis of cortical neurons and reveal that undifferentiated neurons have greater sensitivity than differentiated neurons to DNA damage. (A, B) Mouse cortical neuron apoptosis is time and maturity dependent with exposure to low-dose CPT (A) or ETOP (B). Graphs show the amount of apoptosis in DIV5 (immature) and DIV25 (mature-differentiated) neurons after exposure to 0.5 μM CPT or 0.5 μM ETOP for 24, 48, or 72 h. Values are mean ± SD based on at least 6 images per group. Results were replicated in 3 different cell culture experiments. Symbols denote: significantly greater *P < 0.05, **P < 0.005, and ***P < 0.001 versus control; significantly lower #P < 0.05 versus time-matched DIV5 neurons. (C) The amount of cortical neuron apoptosis induced by ETOP is dose-dependent in DIV5 (immature) and DIV25 (mature-differentiated) neurons. Graph shows the percentage of apoptotic neurons (mean ± SD) determined from 6 images per group. Results were replicated in 3 different cell culture experiments. Symbols denote: significantly greater *P < 0.05, **P < 0.005, and ***P < 0.005 versus vehicle; significantly lower #P < 0.05 versus concentration-matched DIV5 neurons. (D) Neutral comet assay showing the accumulation of DNA-DSBs in immature DIV5 neurons after 4 h exposure to 10 μM ETOP. DNA is stained with SYBR-Green. No control neurons have comet tails. Many ETOP-treated neurons have comet tails indicating DNA-DSBs. Graph shows the percentage of DIV5 and DIV25 neurons with DNA-DSBs after 4 h exposure to 10 μM ETOP as determine by neutral comet assay. Values are mean ± SD, based on at least 10 images per group and were replicated in 2 different culture experiments and comet assays. Symbols denote: significantly greater *P < 0.005, **P < 0.001; significantly lower #P < 0.01 versus DIV5 neurons. (E) p53 gene deletion reduces significantly the amount of apoptosis in DIV5 and DIV25 cortical neurons treated with ETOP for 24 h. Values are mean ± SD based on at least 6 images of Hoechst-stained neurons per group and were replicated in 2 different culture experiments. Symbols denote: significantly lower **P < 0.001 and *P < 0.05 versus wild-type neurons. (F) Mouse cortical neurons without Bax or Bak genes are protected from apoptosis when treated with ETOP for 24 h at DIV5 and DIV25. Apoptosis is reconstituted in Bak−/− mouse cortical neurons by treatment (20 μM) with a cell-permeable Bak-BH3 domain peptide. Mutated Bak-BH3 peptide had no apoptotic activity in cortical neurons (data not shown). Values are mean ± SD based on at least 6 images of Hoechst-stained neurons per group and were replicated in 3 different culture experiments. Symbols denote: significantly lower *P < 0.01 versus wild-type neurons. (G) Mouse cortical neurons without the ATM gene have significantly less apoptosis at DIV5 and DIV25 when treated with ETOP for 24 h. Values are mean ± SD based on at least 6 images of Hoechst-stained neurons per group and were replicated in 3 different culture experiments. Asterisk denotes significantly lower P < 0.01 (DIV5) or P < 0.05 (DIV25) versus ATM+/+ neurons. (H) Small-molecule inhibitors of ATM or c-Abl kinases alter ETOP-induced apoptosis outcome in immature and mature wild-type cortical neurons. Neurons were treated with ATM inhibitors Ku-55933 (10 μM) or caffeine (100 μM) or the c-Abl inhibitor (STI571, 10 μM) for 2 h before exposure to 10 μM ETOP. At 24 h, the neurons were assessed for apoptosis. Values are mean ± SD derived from at least 6 images of Hoechst-stained neurons per group and were replicated in 3 different culture experiments. Symbols denote in DIV5 groups significantly higher **P < 0.001 and *P < 0.01 versus age-matched vehicle-treated neurons and significantly lower #P < 0.01 versus ETOP/vehicle-treated neurons. Symbols denote in DIV25 groups significantly higher **P < 0.01 and *P < 0.05 versus age-matched vehicle-treated neurons, significantly lower #P < 0.05 versus ETOP/vehicle-treated neurons, and significantly higher +P < 0.05 than vehicle only treated control.
Figure 6.
Figure 6.
Cell death protein levels and activation in mouse brain during normal maturation and CPT-induced apoptosis. (A) Western blots of phosphoSer15-p53, Bax, Bak, Noxa, and Puma in normal wild-type mouse forebrains on the day of birth (P0) and at postnatal (P) days 5, 10, 15, 20. Nuclear fractions (10 μg protein) were used for p53. Mitochondrial-enriched fractions (10 μg protein) were used for Bax, Bak, Noxa, and Puma. Blots were re-probed for cofilin to show equivalent protein loading (a representative blot for cofilin is shown). Mitochondrial and cytosolic fractions of adult human motor cortex are positive or negative controls for antibody specificity. (B) Western blots of phosphoSer15-p53, Bax, and Bak in cerebral cortex of wild-type (wt) and bak-null mice injected intraventricularly with 10 μM CPT and killed at 8 or 16 h later. Blots were re-probed for actin to show equivalent protein loading (a representative blot for actin is shown). (C) Intraventricular CPT induces robust apoptosis in mouse brain. Wild-type P5 mice were injected in the right lateral ventricle (arrow) with 10 μM CPT (n = 6) or an equal volume of vehicle (control, n = 6) and were killed 24 h later. CPT-induced marked dilation of the lateral ventricles and shrinkage of the striatum. Numerous apoptotic cells were seen in cerebral cortex of CPT-treated mice (lower right panel and inset) but not in vehicle-injected mice (upper right panel). Scale bars: 500 μm (left panels); 22.5 μm (right panels); 5 μm (inset).
Figure 7.
Figure 7.
Summary diagram illustrating the molecular regulation of apoptosis in immature and differentiated cortical neurons induced by DNA damage. Differences in font sizes reflect the weight of the particular protein or inhibitor (the smaller the font the less involvement or magnitude of change).

References

    1. Adamec E, Vonsattel JP, Nixon RA. DNA strand breaks in Alzheimer's disease. Brain Res. 1999;849:67–77. - PubMed
    1. Bendixen C, Thomsen B, Alsner J, Westergaard O. Camptothecin-stabilized topoisomerase I-DNA adducts cause premature termination of transcription. Biochemistry. 1990;29:5613–5619. - PubMed
    1. Bernardi P, Krauskopf A, Basso E, Petronilli V, Blalchy-Dyson E, Di Lisa F, Forte MA. The mitochondrial permeability transition from in vitro artifact to disease target. FEBS J. 2006;273:2077–2099. - PubMed
    1. Blasina A, Price BD, Turenne GA, McGowan CH. Caffeine inhibits the checkpoint kinase ATM. Curr Biol. 1999;9:1135–1138. - PubMed
    1. Bombrun A, Gerber P, Casi G, Terradillos O, Antonsson B, Halazy S. 3,6-Dibromocarbazole piperazine derivatives of 2-propanol as first inhibitors of cytochrome c release via bax channel modulation. J Med Chem. 2003;46:4365–4368. - PubMed

Publication types

Substances