. 2008 Nov;11(11):1343-51.
doi: 10.1038/nn.2199. Epub 2008 Sep 28.

Origin of correlated activity between parasol retinal ganglion cells

Affiliations

Origin of correlated activity between parasol retinal ganglion cells

Philipp Khuc Trong et al. Nat Neurosci. 2008 Nov.

Abstract

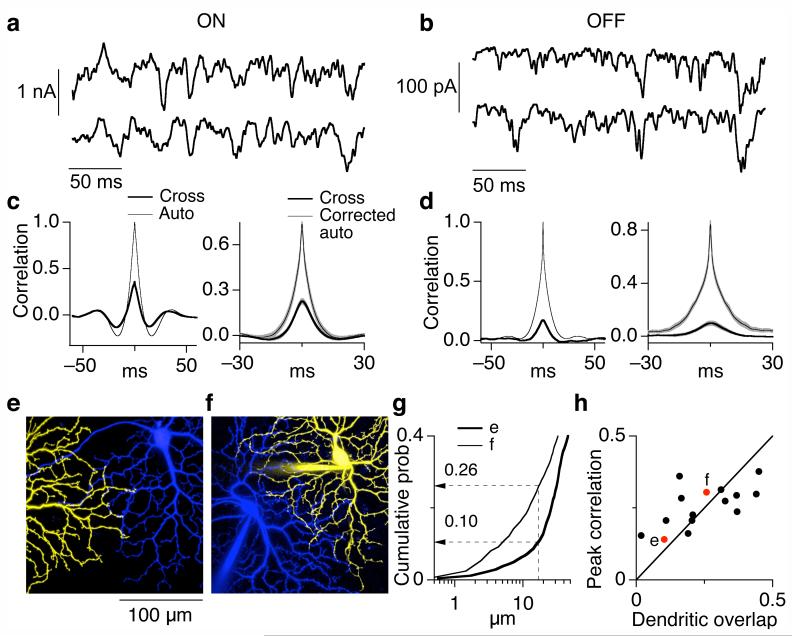
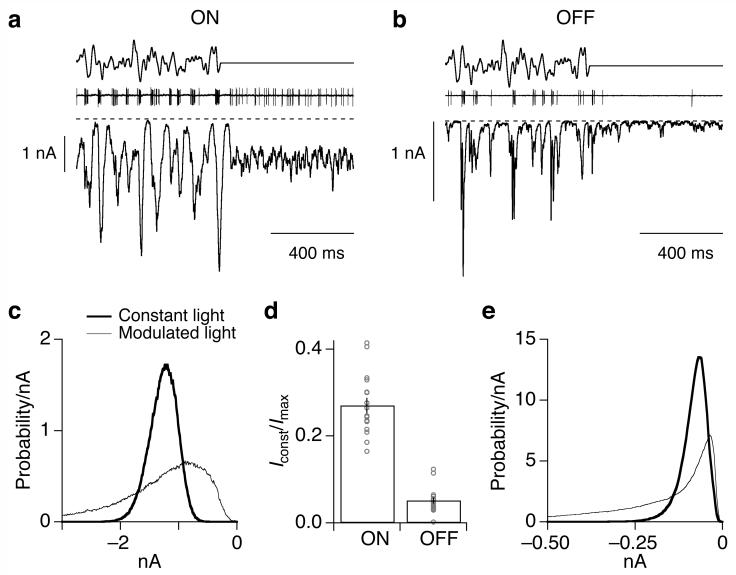
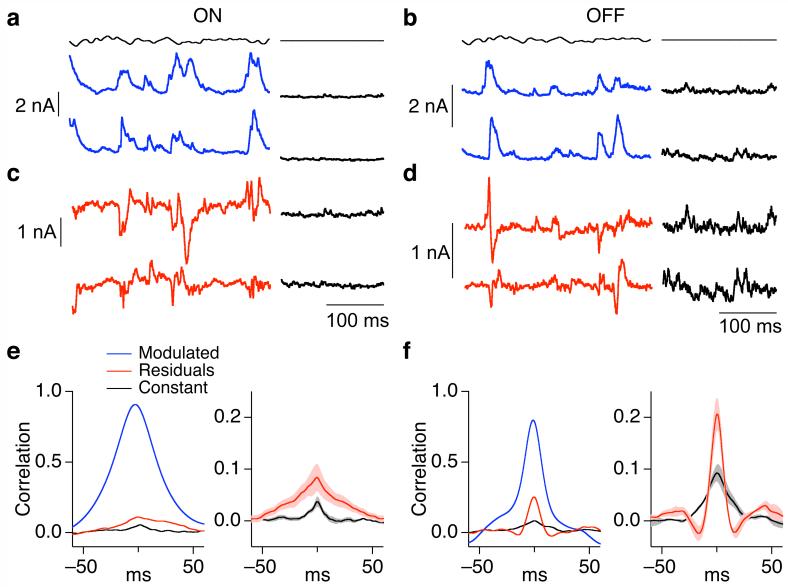
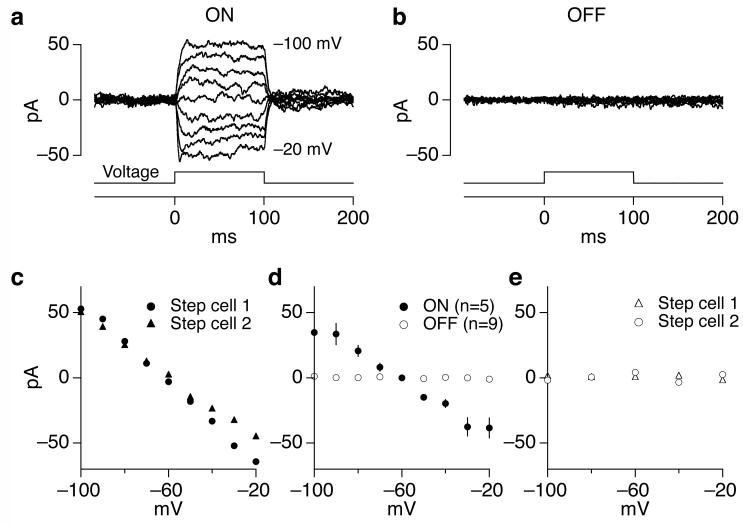
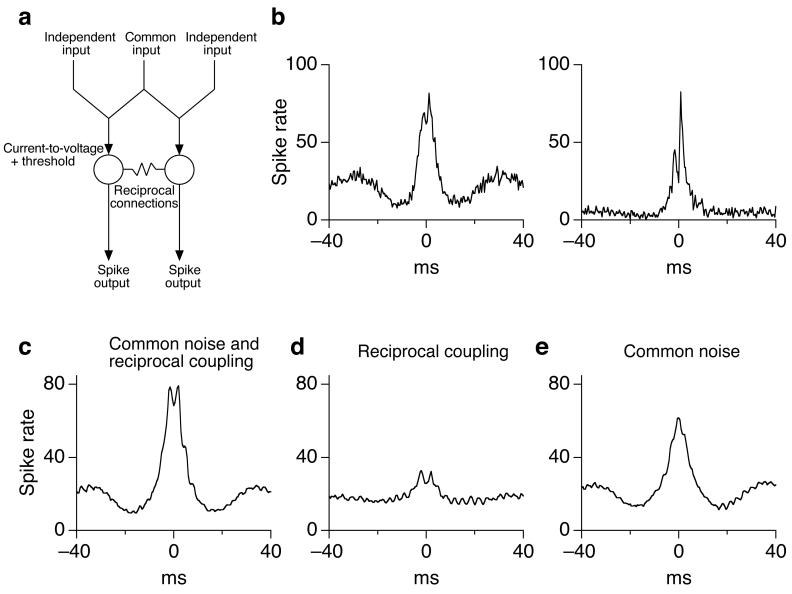
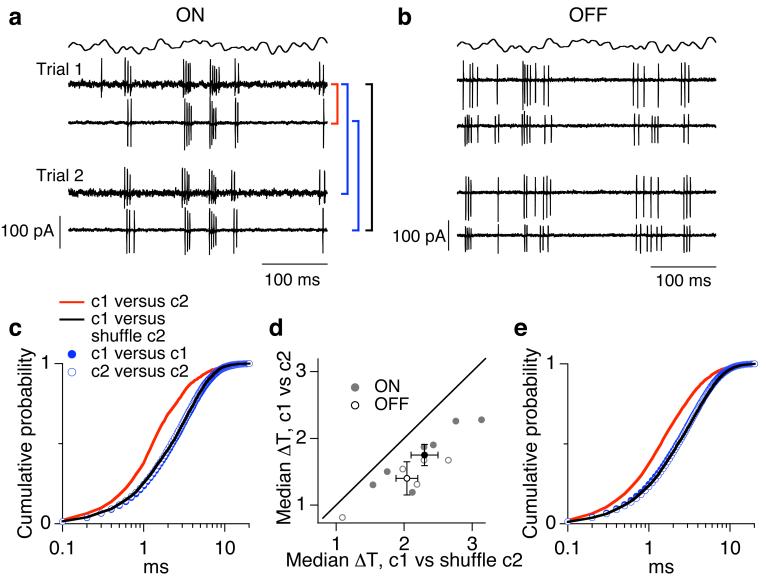
Cells throughout the CNS have synchronous activity patterns; that is, a cell's probability of generating an action potential depends both on its firing rate and on the occurrence of action potentials in surrounding cells. The mechanisms producing synchronous or correlated activity are poorly understood despite its prevalence and potential effect on neural coding. We found that neighboring parasol ganglion cells in primate retina received strongly correlated synaptic input in the absence of modulated light stimuli. This correlated variability appeared to arise through the same circuits that provide uncorrelated synaptic input. In addition, ON, but not OFF, parasol cells were coupled electrically. Correlated variability in synaptic input, however, dominated correlations in the parasol spike outputs and shared variability in the timing of action potentials generated by neighboring cells. These results provide a mechanistic picture of how correlated activity is produced in a population of neurons that are critical for visual perception.


Figures

Figure 1
Figure 1
Correlated variability in the synaptic inputs to neighboring ON and OFF parasol cells. (a, b) Simultaneously measured excitatory synaptic inputs to neighboring ON (a) and OFF (b) parasol cells at a holding potential of -70 mV. During recording the retina was exposed to a constant light producing ∼4,000 P*/cone/sec in M cones. (c, d) Quantification of common noise in synaptic inputs to neighboring parasol cells. The left panels compare the autocorrelation function (thin trace, average for two cells in pair) with the cross-correlation function (thick trace) for the cells in a and b. The right panels show the average cross-correlation functions and the corrected autocorrelation functions (mean ± SEM) across ON (c, n=16) and OFF (d, n=9) parasol pairs. 26 ± 2% (10 ± 2%) of the total variance was shared in ON (OFF) pairs. (e, f) Images of neighboring ON parasol cells with atypically little dendritic overlap (e) and typical dendritic overlap (f). The images shown are maximum point projections from a stack of images taken in different focal planes. (g) Cumulative distributions of nearest-neighbor dendritic distances for the cell pairs in e and f. (h) Dependence of correlation strength on dendritic overlap. Dendritic overlap was quantified from cumulative distributions as in g; locations on one cell within 17 μm of a location on the other cell were defined as overlapping.
Figure 2
Figure 2
OFF parasol cells receive less tonic excitatory input than ON parasol cells. (a, b) Stimulus (top), cell-attached recording of spike response (middle), and excitatory synaptic currents (bottom, holding potential -70 mV) for an ON (a) and an OFF (b) parasol cell. The mean light intensity produced ∼4,000 P*/cone/sec in M cones. Larger inward currents correspond to increased excitatory input. The dashed line denotes the current level without excitatory synaptic input, estimated from smallest current value observed during recording; this level was similar to the current remaining with glutamate, GABA and glycine receptors blocked (not shown). (c) Distribution of current amplitudes during modulated stimulus (thin trace) and constant light (thick trace) from the ON parasol cell in A. (d) Summary of tonic excitatory synaptic input to ON (n=18) and OFF (n=17) parasol cells during constant light. Points plot the mean current in constant light divided by the maximum current magnitude achieved during the modulated stimulus. (e) Distribution of current amplitudes for the OFF parasol in b.
Figure 3
Figure 3
Common noise in the excitatory synaptic inputs to OFF but not ON parasol cells depends on stimulus properties. (a, b) Simultaneously measured excitatory synaptic currents of neighboring ON (a) and OFF (b) parasol cells to a single presentation of a 50% contrast fluctuating stimulus (blue trace). During recording the retina was exposed to a constant light producing ∼4,000 P*/cone/sec in M cones. Same cell pairs as Figure 1. (c, d) Residuals of responses from a and b, computed by subtracting the average response to 10 repetitions of the modulated stimulus from the individual responses. (e, f) Properties of correlated synaptic input for neighboring ON (e) and OFF (f) parasol cells. Left panels compare cross-correlation functions for total synaptic input during fluctuating light stimulus (blue trace), residuals during fluctuating light stimulus (red trace) and constant light (black trace). Right panels compare average cross-correlation functions (mean ± SEM, n=8 for ON pairs, n=9 for OFF pairs) for the residuals of the responses to modulated light and responses during constant light. The peak crosscorrelation during modulated light was 0.29 ± 0.04 in ON pairs (mean ± SEM) and 0.27 ± 0.03 in OFF pairs.
Figure 4
Figure 4
Correlations in the inhibitory synaptic inputs to ON and OFF parasol cells. (a, b) Simultaneously measured inhibitory synaptic currents (holding potential ∼15 mV) of neighboring ON (a) and OFF (b) parasol cells to a single presentation of a 50% contrast fluctuating stimulus (blue trace). (c, d) Residuals of responses from a and b, computed by subtracting the average response to 10 repetitions of the modulated stimulus from the individual responses. (e, f) Properties of correlated synaptic input for neighboring ON (e) and OFF (f) parasol cells. Left panels compare cross-correlation functions for total synaptic input during fluctuating light stimulus (blue trace), residuals during fluctuating light stimulus (red trace) and constant light (black trace). Right panels compare average cross-correlation functions (mean ± SEM, n=7 for ON pairs, n=4 for OFF pairs) for the residuals of the responses to modulated light and responses during constant light.
Figure 5
Figure 5
ON but not OFF cells are effectively reciprocally coupled. (a, b) Coupling currents produced in an ON (a) or OFF (b) parasol cell by stepping the voltage of a neighboring ON or OFF cell. Voltage steps ranged from -100 to -20 mV in 10 (a) or 20 (b) mV increments. Holding potential of both cells was -60 mV. (c) Steady-state current measured during the second half of the step plotted against step voltage. Circles plot data from a, and triangles plot data when the coupling was measured in the opposite direction (i.e. when the voltage step was applied to the other cell). (d) Collected measurements of current-voltage relations for reciprocal connections. The rectification at large voltage differences likely was due to uncompensated series resistance, which would cause the actual voltage difference to be smaller than expected. The effective coupling resistance between ON parasol cells (the inverse of the slope of the current-voltage relation) was 880 ± 80 MOhm. The effective coupling resistance between OFF parasol pairs (resistance > 100 GOhm) was at least 100 times higher. (e) Current-voltage relation for OFF parasol pair from b. Activity of receptors mediating chemical synaptic transmission was suppressed with 10 μM NBQX, 20 μM APV and 10 μM strychnine.
Figure 6
Figure 6
Contributions of common noise and reciprocal connections to correlations between spike trains of ON parasol cells. (a) Schematic of model. (b) Two examples of measured cross-correlation functions for spike responses of neighboring ON parasol cells exposed to constant light. (c) Predicted cross-correlation function for ‘standard’ model with all parameters equal to those measured experimentally. (d) Predicted cross-correlation function with no common noise. (e) Predicted cross-correlation function with no reciprocal connections.
Figure 7
Figure 7
Correlations affect temporal precision of ganglion cell spike responses. (a, b). Cell attached recordings of spike responses of neighboring ON (a) and OFF (b) parasol cells during modulated light stimulus. Responses to two repeats of the stimulus are shown for each cell pair. (c) Temporal precision of spike responses. Cumulative distributions of temporal offsets between spikes were calculated using the Victor distance metric to create spike pairs. Cumulative distributions are shown for responses of different cells recorded simultaneously (red) and nonsimultaneously (black) as well as for the same cell on different trials (blue and green circles). (d) Collected measurements of temporal precision for all pairs of ON (n=7) and OFF (n=5) parasol cells. (e) Temporal precision of spike responses for neighboring OFF parasol cells as in c.
Figure 8
Figure 8
Working model for mechanistic basis of correlated activity in neighboring ON and OFF parasol cells.

References

    1. Usrey WM, Reid RC. Synchronous activity in the visual system. Annu Rev Physiol. 1999;61:435–456. - PubMed
    1. Averbeck BB, Latham PE, Pouget A. Neural correlations, population coding and computation. Nat Rev Neurosci. 2006;7:358–366. - PubMed
    1. Meister M, Lagnado L, Baylor DA. Concerted signaling by retinal ganglion cells. Science. 1995;270:1207–1210. - PubMed
    1. Dan Y, Alonso JM, Usrey WM, Reid RC. Coding of visual information by precisely correlated spikes in the lateral geniculate nucleus. Nat Neurosci. 1998;1:501–507. - PubMed
    1. Pillow JW, et al. Spatio-temporal correlations and visual signalling in a complete neuronal population. Nature. 2008 - PMC - PubMed

Publication types