

Specific absorption rate studies of the parallel transmission of inner-volume excitations at 7T
- PMID: 18821601
- PMCID: PMC2590645
- DOI: 10.1002/jmri.21548
Specific absorption rate studies of the parallel transmission of inner-volume excitations at 7T
Abstract
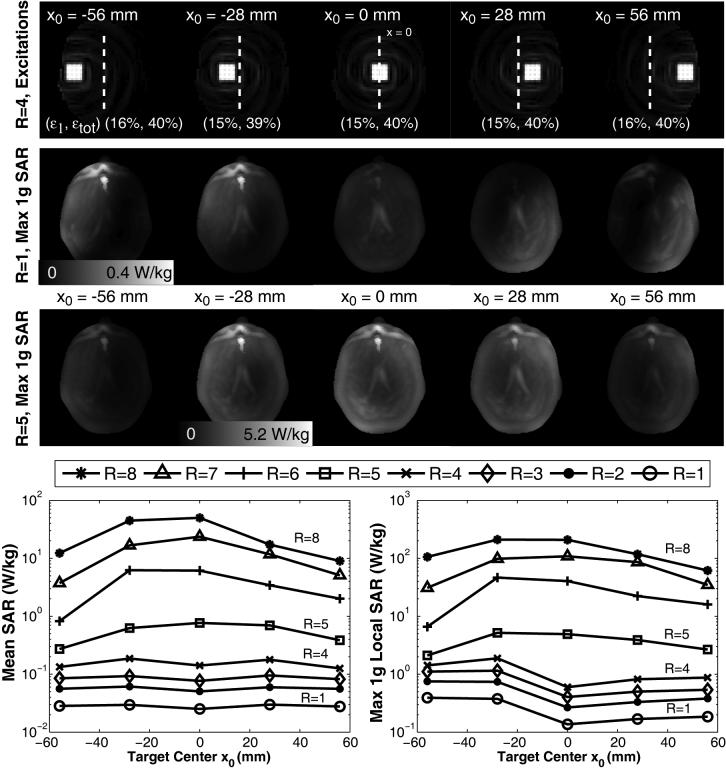
Purpose: To investigate the behavior of whole-head and local specific absorption rate (SAR) as a function of trajectory acceleration factor and target excitation pattern due to the parallel transmission (pTX) of spatially tailored excitations at 7T.
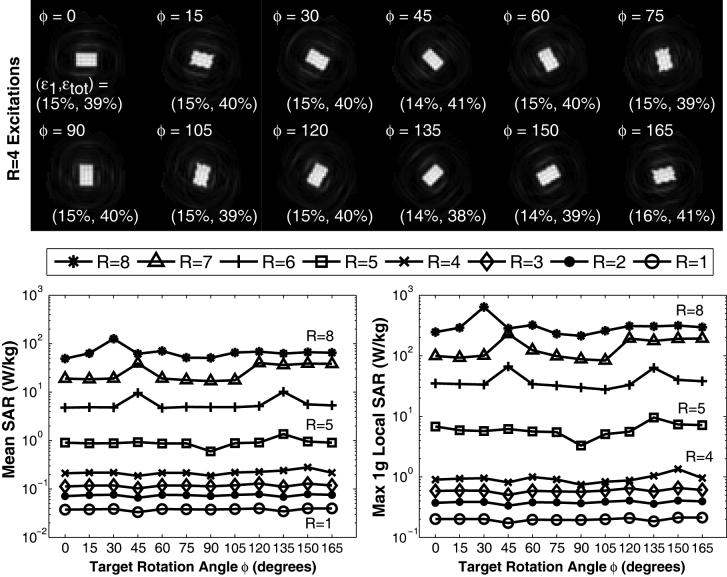
Materials and methods: Finite-difference time domain (FDTD) simulations in a multitissue head model were used to obtain B(1) (+) and electric field maps of an eight-channel transmit head array. Local and average SAR produced by 2D-spiral-trajectory excitations were examined as a function of trajectory acceleration factor, R, and a variety of target excitation parameters when pTX pulses are designed for constant root-mean-square excitation pattern error.
Results: Mean and local SAR grow quadratically with flip angle and more than quadratically with R, but the ratio of local to mean SAR is not monotonic with R. SAR varies greatly with target position, exhibiting different behaviors as a function of target shape and size for small and large R. For example, exciting large regions produces less SAR than exciting small ones for R >or=4, but the opposite trend occurs when R <4. Furthermore, smoother and symmetric patterns produce lower SAR.
Conclusion: Mean and local SAR vary by orders of magnitude depending on acceleration factor and excitation pattern, often exhibiting complex, nonintuitive behavior. To ensure safety compliance, it seems that model-based validation of individual target patterns and corresponding pTX pulses is necessary.
(c) 2008 Wiley-Liss, Inc.
Figures


Similar articles
-
Design of parallel transmission pulses for simultaneous multislice with explicit control for peak power and local specific absorption rate.Magn Reson Med. 2015 May;73(5):1946-53. doi: 10.1002/mrm.25325. Epub 2014 Jun 17. Magn Reson Med. 2015. PMID: 24938991 Free PMC article.
-
Comparison of tight-fitting 7T parallel-transmit head array designs using excitation uniformity and local specific absorption rate metrics.Magn Reson Med. 2024 Mar;91(3):1209-1224. doi: 10.1002/mrm.29900. Epub 2023 Nov 6. Magn Reson Med. 2024. PMID: 37927216 Free PMC article.
-
Parallel excitation with an array of transmit coils.Magn Reson Med. 2004 Apr;51(4):775-84. doi: 10.1002/mrm.20011. Magn Reson Med. 2004. PMID: 15065251
-
Simultaneous multislice excitation by parallel transmission.Magn Reson Med. 2014 Apr;71(4):1416-27. doi: 10.1002/mrm.24791. Epub 2013 May 28. Magn Reson Med. 2014. PMID: 23716365 Free PMC article.
-
Specific absorption rate (SAR) simulations for low-field (< 0.1 T) MRI systems.MAGMA. 2023 Jul;36(3):429-438. doi: 10.1007/s10334-023-01073-3. Epub 2023 Mar 18. MAGMA. 2023. PMID: 36933091 Free PMC article. Review.
Cited by
-
The Virtual Patient Simulator of Deep Brain Stimulation in the Obsessive Compulsive Disorder Based on Connectome and 7 Tesla MRI Data.Cogn Int Conf Adv Cogn Technol Appl. 2014;2014:235-238. Cogn Int Conf Adv Cogn Technol Appl. 2014. PMID: 25506052 Free PMC article.
-
UltraHigh Field MR Imaging in Epilepsy.Magn Reson Imaging Clin N Am. 2021 Feb;29(1):41-52. doi: 10.1016/j.mric.2020.09.006. Magn Reson Imaging Clin N Am. 2021. PMID: 33237014 Free PMC article. Review.
-
Toward cardiovascular MRI at 7 T: clinical needs, technical solutions and research promises.Eur Radiol. 2010 Dec;20(12):2806-16. doi: 10.1007/s00330-010-1902-8. Epub 2010 Jul 31. Eur Radiol. 2010. PMID: 20676653 Free PMC article. Review.
-
Evaluation of Common RF Coil Setups for MR Imaging at Ultrahigh Magnetic Field: A Numerical Study.Int Symp Appl Sci Biomed Commun Technol. 2011;2011:70. doi: 10.1145/2093698.2093768. Int Symp Appl Sci Biomed Commun Technol. 2011. PMID: 28966929 Free PMC article.
-
Specific absorption rate benefits of including measured electric field interactions in parallel excitation pulse design.Magn Reson Med. 2012 Jan;67(1):164-74. doi: 10.1002/mrm.23004. Epub 2011 Aug 29. Magn Reson Med. 2012. PMID: 22135040 Free PMC article.
References
-
- Graesslin I, Vernickel P, Schmidt J, et al. Whole Body 3T MRI System with Eight Parallel RF Transmission Channels 2006Proceedings of the 14th Annual Meeting of ISMRMSeattle, WA, USA (abstract 129).
-
- Katscher U, Bornert P, Leussler C, van den Brink JS. Transmit SENSE. Magn Reson Med. 2003;49(1):144–150. - PubMed
-
- Setsompop K, Wald LL, Alagappan V, et al. Parallel RF Transmission with 8 Channels at 3 Tesla. Magn Reson Med. 2006;56(5):1163–1171. - PubMed
-
- Ullmann P, Junge S, Wick M, Seifert F, Ruhm W, Hennig J. Experimental analysis of parallel excitation using dedicated coil setups and simultaneous RF transmission on multiple channels. Magn Reson Med. 2005;54(4):994–1001. - PubMed
-
- Zhu Y. Parallel excitation with an array of transmit coils. Magn Reson Med. 2004;51(4):775–784. - PubMed
Publication types
MeSH terms
Grants and funding
LinkOut - more resources
Full Text Sources
Other Literature Sources
Medical
Miscellaneous
