

Signal features of the atherosclerotic plaque at 3.0 Tesla versus 1.5 Tesla: impact on automatic classification
- PMID: 18821634
- PMCID: PMC2808211
- DOI: 10.1002/jmri.21529
Signal features of the atherosclerotic plaque at 3.0 Tesla versus 1.5 Tesla: impact on automatic classification
Abstract
Purpose: To investigate the impact of different field strengths on determining plaque composition with an automatic classifier.
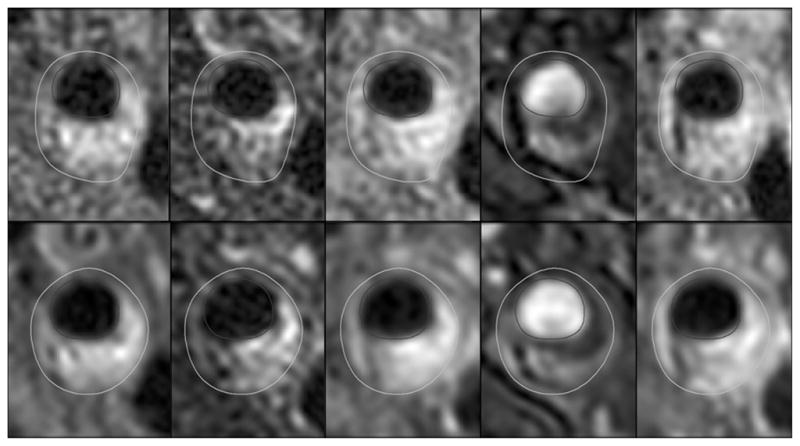
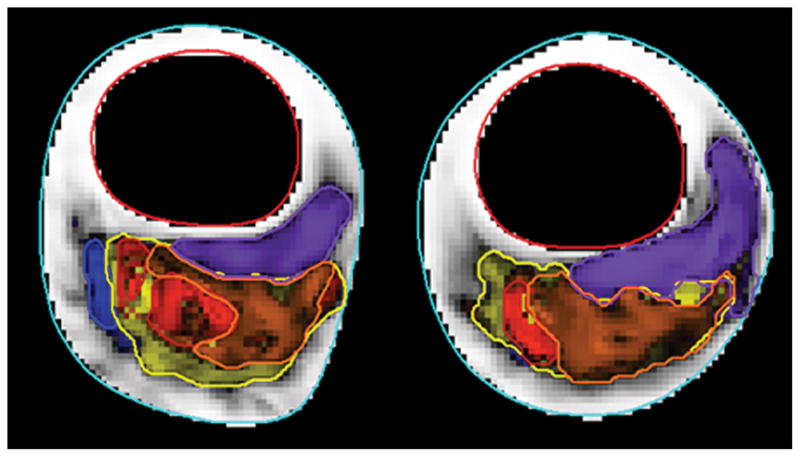
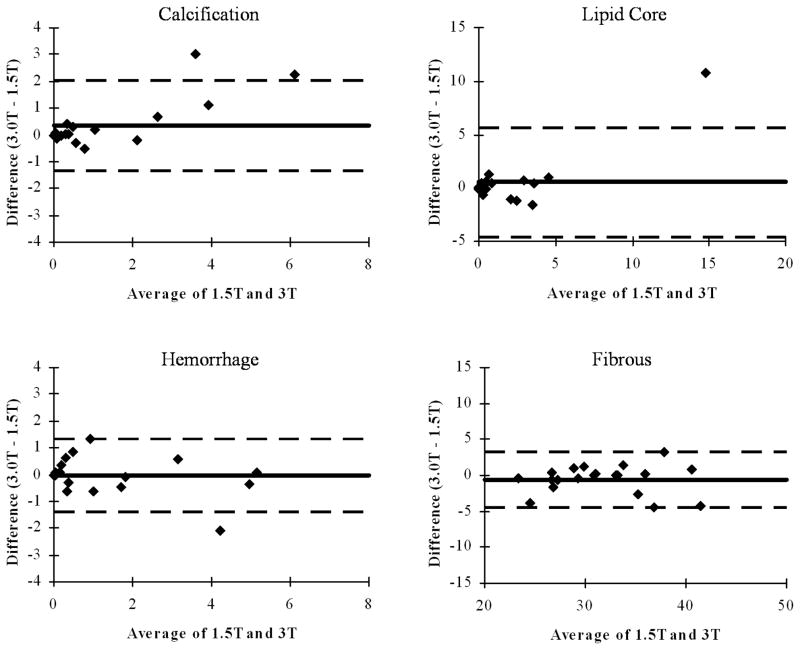
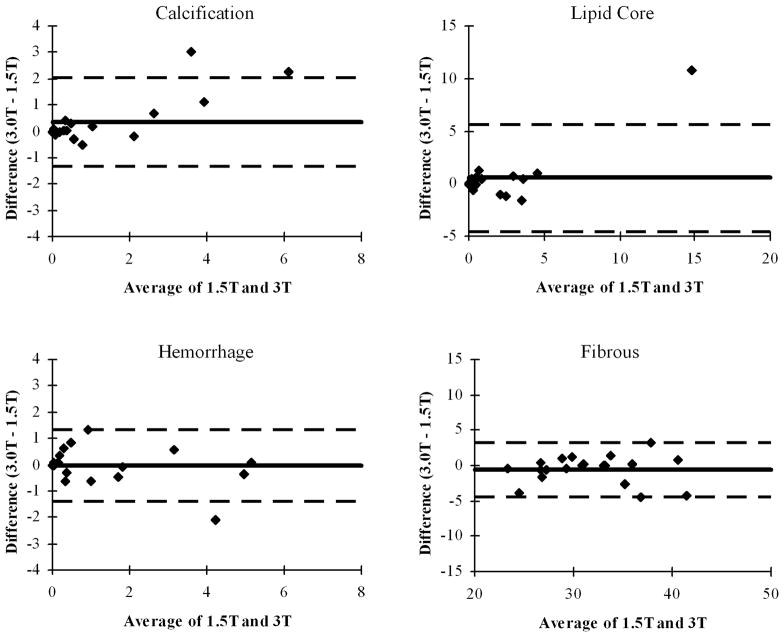
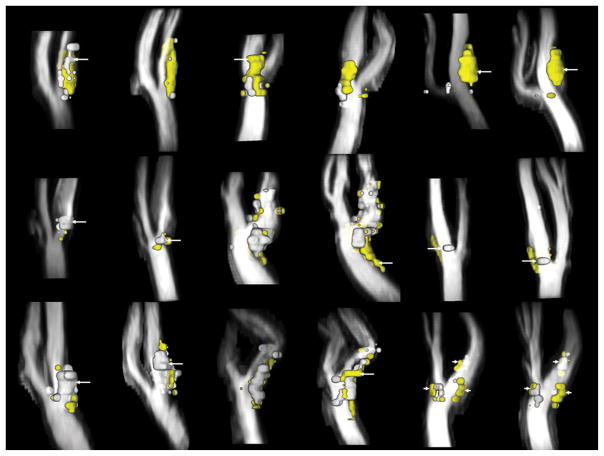
Materials and methods: We applied a previously developed automatic classifier-the morphology enhanced probabilistic plaque segmentation (MEPPS) algorithm-to images from 20 subjects scanned at both 1.5 Tesla (T) and 3T. Average areas per slice of lipid-rich core, intraplaque hemorrhage, calcification, and fibrous tissue were recorded for each subject and field strength.
Results: All measurements showed close agreement at the two field strengths, with correlation coefficients of 0.91, 0.93, 0.95, and 0.93, respectively. None of these measurements showed a statistically significant difference between field strengths in the average area per slice by a paired t-test, although calcification tended to be measured larger at 3T (P = 0.09).
Conclusion: Automated classification results using an identical algorithm at 1.5T and 3T produced highly similar results, suggesting that with this acquisition protocol, 3T signal characteristics of the atherosclerotic plaque are sufficiently similar to 1.5T characteristics for MEPPS to provide equivalent performance.
(c) 2008 Wiley-Liss, Inc.
Figures
Similar articles
-
In vivo semi-automatic segmentation of multicontrast cardiovascular magnetic resonance for prospective cohort studies on plaque tissue composition: initial experience.Int J Cardiovasc Imaging. 2016 Jan;32(1):73-81. doi: 10.1007/s10554-015-0704-0. Epub 2015 Jul 14. Int J Cardiovasc Imaging. 2016. PMID: 26169389 Free PMC article.
-
Segmentation of carotid plaque using multicontrast 3D gradient echo MRI.J Magn Reson Imaging. 2012 Apr;35(4):812-9. doi: 10.1002/jmri.22886. Epub 2011 Nov 29. J Magn Reson Imaging. 2012. PMID: 22127812 Free PMC article.
-
Atherosclerotic Carotid Plaque Composition: A 3T and 7T MRI-Histology Correlation Study.J Neuroimaging. 2016 Jul;26(4):406-13. doi: 10.1111/jon.12332. Epub 2016 Feb 25. J Neuroimaging. 2016. PMID: 26919134
-
Contemporary carotid imaging: from degree of stenosis to plaque vulnerability.J Neurosurg. 2016 Jan;124(1):27-42. doi: 10.3171/2015.1.JNS142452. Epub 2015 Jul 31. J Neurosurg. 2016. PMID: 26230478 Review.
-
Sex Differences in Carotid Atherosclerosis: A Systematic Review and Meta-Analysis.Stroke. 2023 Feb;54(2):315-326. doi: 10.1161/STROKEAHA.122.041046. Epub 2022 Nov 29. Stroke. 2023. PMID: 36444718 Free PMC article.
Cited by
-
Advanced techniques for MRI of atherosclerotic plaque.Top Magn Reson Imaging. 2009 Aug;20(4):217-25. doi: 10.1097/RMR.0b013e3181ea2853. Top Magn Reson Imaging. 2009. PMID: 20805732 Free PMC article. Review.
-
Microvasculature and intraplaque hemorrhage in atherosclerotic carotid lesions: a cardiovascular magnetic resonance imaging study.J Cardiovasc Magn Reson. 2019 Mar 4;21(1):15. doi: 10.1186/s12968-019-0524-9. J Cardiovasc Magn Reson. 2019. PMID: 30832656 Free PMC article.
-
Carotid magnetic resonance imaging for monitoring atherosclerotic plaque progression: a multicenter reproducibility study.Int J Cardiovasc Imaging. 2015 Jan;31(1):95-103. doi: 10.1007/s10554-014-0532-7. Epub 2014 Sep 13. Int J Cardiovasc Imaging. 2015. PMID: 25216871 Free PMC article.
-
Quantitative Analysis of Lipid-Rich Necrotic Core in Carotid Atherosclerotic Plaques by In Vivo Magnetic Resonance Imaging and Clinical Outcomes.Med Sci Monit. 2017 Jun 6;23:2745-2750. doi: 10.12659/msm.901864. Med Sci Monit. 2017. PMID: 28584227 Free PMC article.
-
Immersive visualization for enhanced computational fluid dynamics analysis.J Biomech Eng. 2015 Mar;137(3):0310041-03100412. doi: 10.1115/1.4029017. Epub 2015 Jan 29. J Biomech Eng. 2015. PMID: 25378201 Free PMC article.
References
-
- Yarnykh VL, Terashima M, Hayes CE, et al. Multicontrast black-blood MRI of carotid arteries: comparison between 1.5 and 3 tesla magnetic field strengths. J Magn Reson Imaging. 2006;23:691–698. - PubMed
-
- Alizadeh Dehnavi R, Doornbos J, Tamsma JT, et al. Assessment of the carotid artery by MRI at 3T: a study on reproducibility. J Magn Reson Imaging. 2007;25:1035–1043. - PubMed
-
- Saam T, Ferguson MS, Yarnykh VL, et al. Quantitative evaluation of carotid plaque composition by in vivo MRI. Arterioscler Throm Vasc Biol. 2005;25:234–239. - PubMed
-
- Chu B, Kampschulte A, Ferguson MS, et al. Hemorrhage in the atherosclerotic carotid plaque: A high-resolution MRI study. Stroke. 2004;35:1079–1084. - PubMed
-
- Yuan C, Mitsumori LM, Ferguson MS, et al. In vivo accuracy of multispectral magnetic resonance imaging for identifying lipid-rich necrotic cores and intraplaque hemorrhage in advanced human carotid plaques. Circulation. 2001;104:2051–2056. - PubMed
Publication types
MeSH terms
Substances
Grants and funding
LinkOut - more resources
Full Text Sources
Other Literature Sources
Medical
