

Evidence of inflammatory immune signaling in chronic fatigue syndrome: A pilot study of gene expression in peripheral blood
- PMID: 18822143
- PMCID: PMC2569951
- DOI: 10.1186/1744-9081-4-44
Evidence of inflammatory immune signaling in chronic fatigue syndrome: A pilot study of gene expression in peripheral blood
Abstract
Background: Genomic profiling of peripheral blood reveals altered immunity in chronic fatigue syndrome (CFS) however interpretation remains challenging without immune demographic context. The object of this work is to identify modulation of specific immune functional components and restructuring of co-expression networks characteristic of CFS using the quantitative genomics of peripheral blood.
Methods: Gene sets were constructed a priori for CD4+ T cells, CD8+ T cells, CD19+ B cells, CD14+ monocytes and CD16+ neutrophils from published data. A group of 111 women were classified using empiric case definition (U.S. Centers for Disease Control and Prevention) and unsupervised latent cluster analysis (LCA). Microarray profiles of peripheral blood were analyzed for expression of leukocyte-specific gene sets and characteristic changes in co-expression identified from topological evaluation of linear correlation networks.
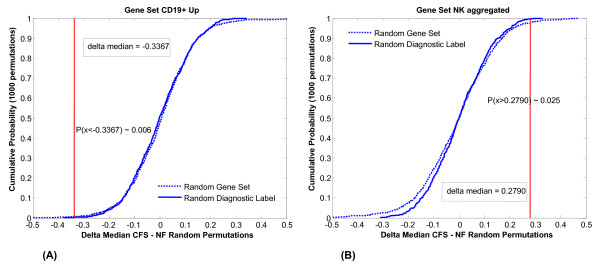
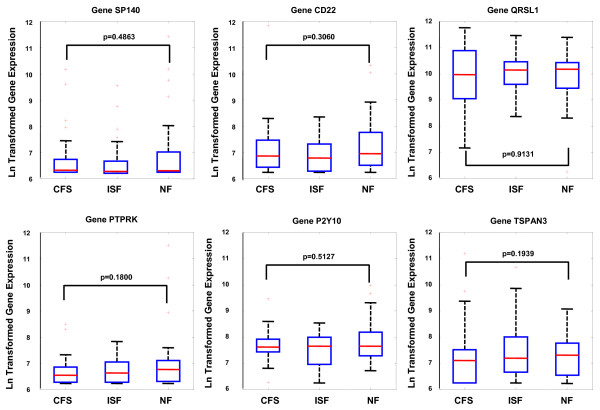
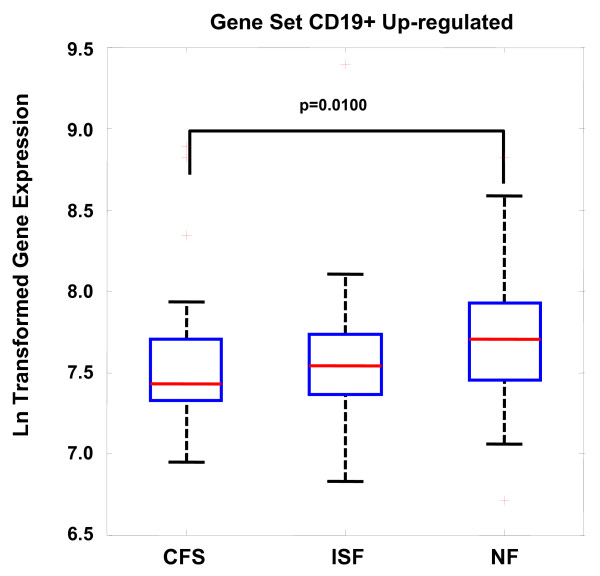
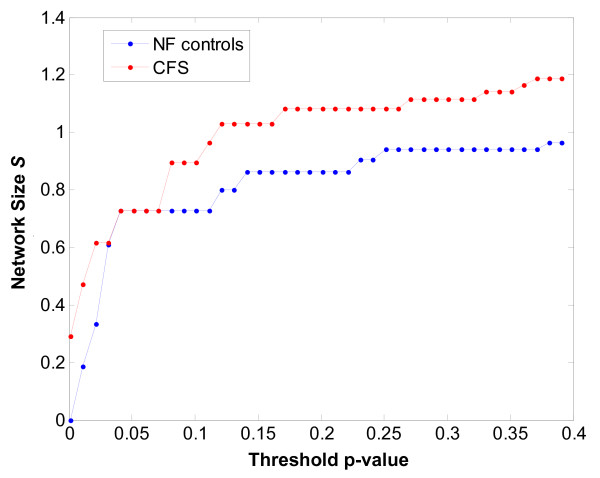
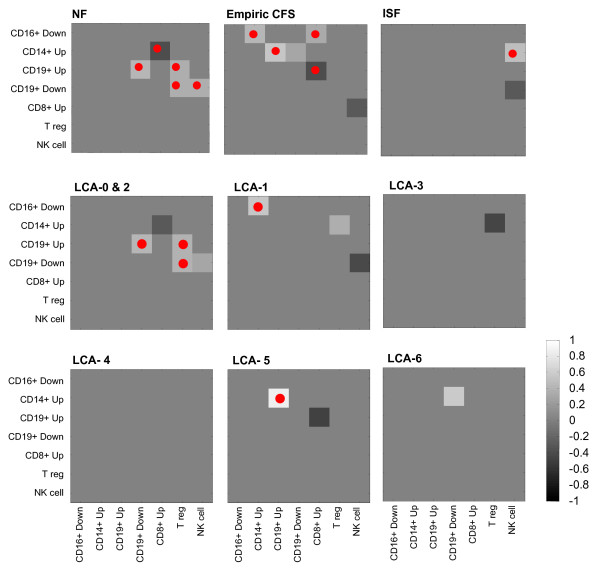
Results: Median expression for a set of 6 genes preferentially up-regulated in CD19+ B cells was significantly lower in CFS (p = 0.01) due mainly to PTPRK and TSPAN3 expression. Although no other gene set was differentially expressed at p < 0.05, patterns of co-expression in each group differed markedly. Significant co-expression of CD14+ monocyte with CD16+ neutrophil (p = 0.01) and CD19+ B cell sets (p = 0.00) characterized CFS and fatigue phenotype groups. Also in CFS was a significant negative correlation between CD8+ and both CD19+ up-regulated (p = 0.02) and NK gene sets (p = 0.08). These patterns were absent in controls.
Conclusion: Dissection of blood microarray profiles points to B cell dysfunction with coordinated immune activation supporting persistent inflammation and antibody-mediated NK cell modulation of T cell activity. This has clinical implications as the CD19+ genes identified could provide robust and biologically meaningful basis for the early detection and unambiguous phenotyping of CFS.
Figures
References
-
- Tirelli U, Bernardi D, Improta S, Pinto A. Immunologic abnormalities in chronic fatigue syndrome. J Chronic Fatigue Syndrome. 1996;2:85–96. doi: 10.1300/J092v02n01_07. - DOI
LinkOut - more resources
Full Text Sources
Other Literature Sources
Research Materials
