. 2008 Nov 16;121(1):61-73.
doi: 10.1016/j.imlet.2008.08.007. Epub 2008 Sep 24.

Pathogenic anti-DNA antibodies modulate gene expression in mesangial cells: involvement of HMGB1 in anti-DNA antibody-induced renal injury

Affiliations

Pathogenic anti-DNA antibodies modulate gene expression in mesangial cells: involvement of HMGB1 in anti-DNA antibody-induced renal injury

Xiaoping Qing et al. Immunol Lett. .

Abstract

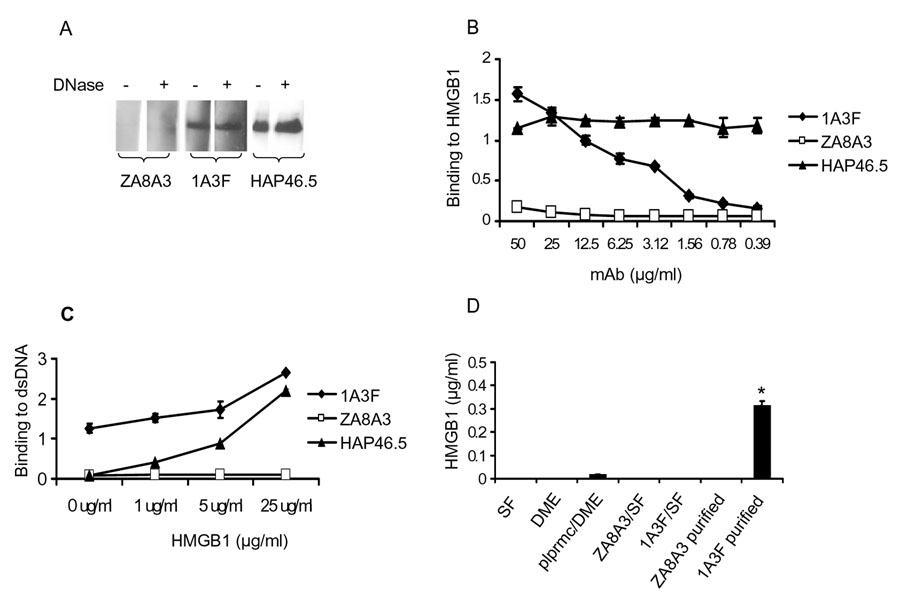
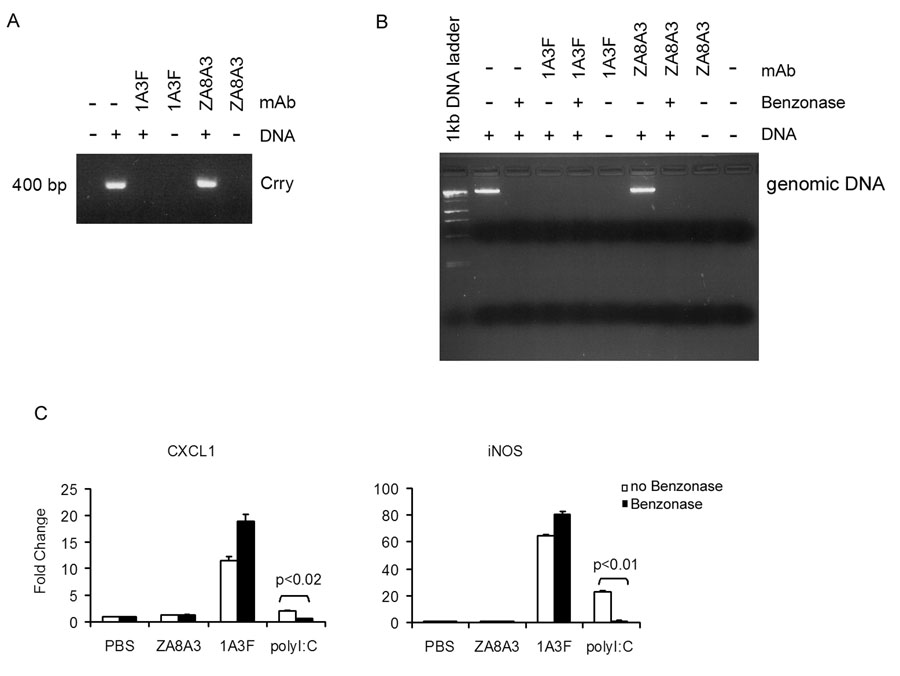
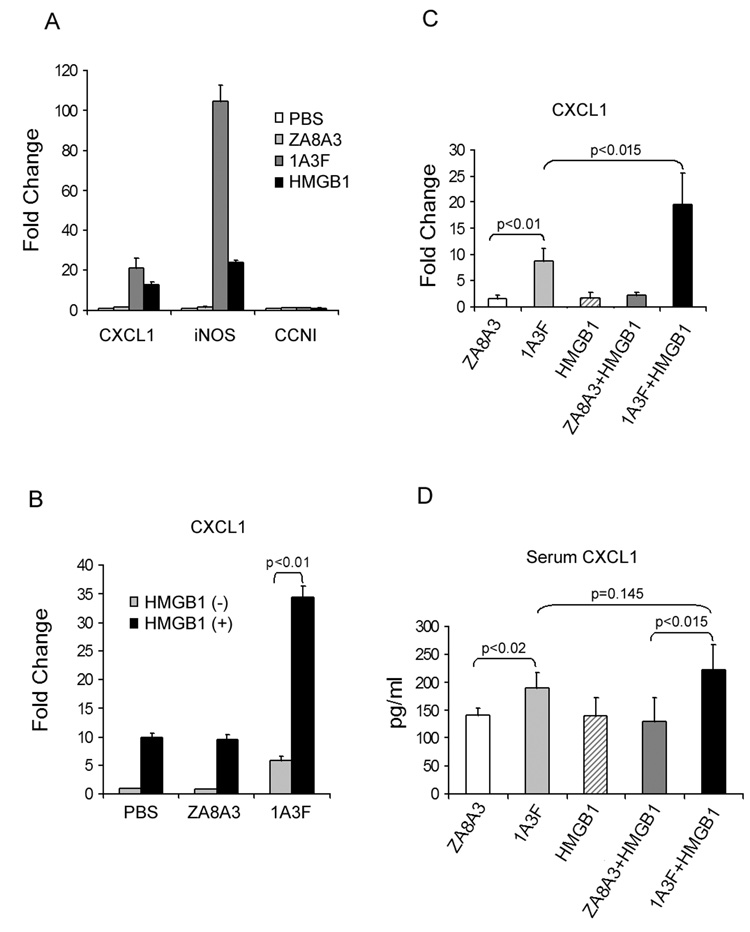
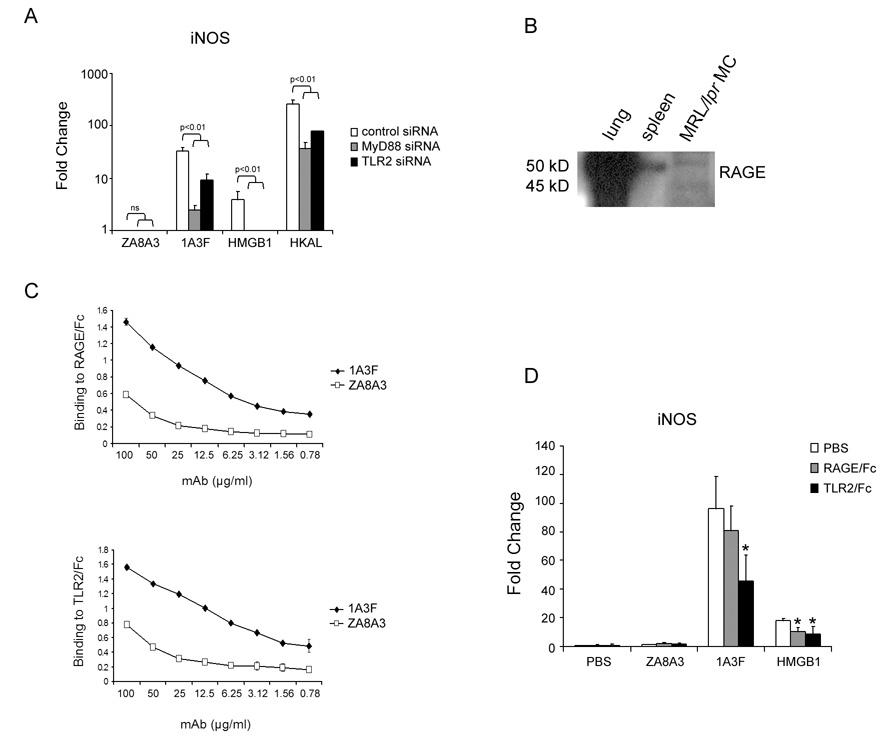
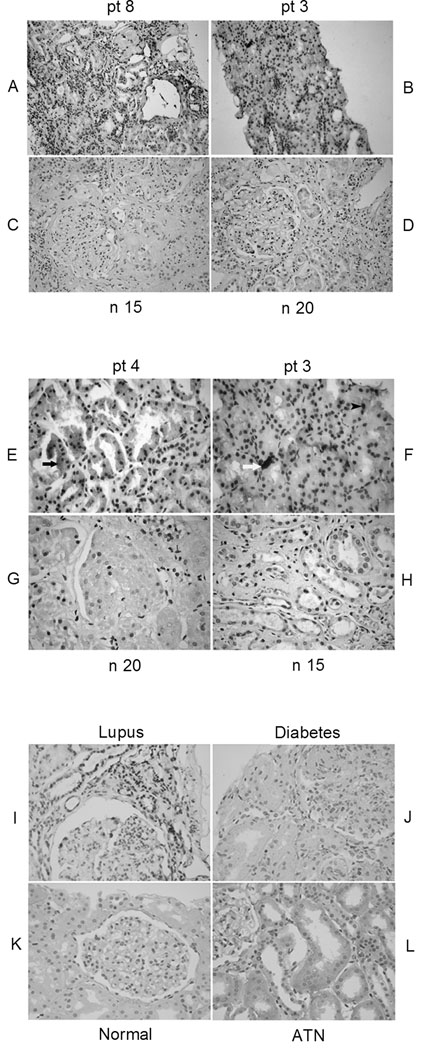
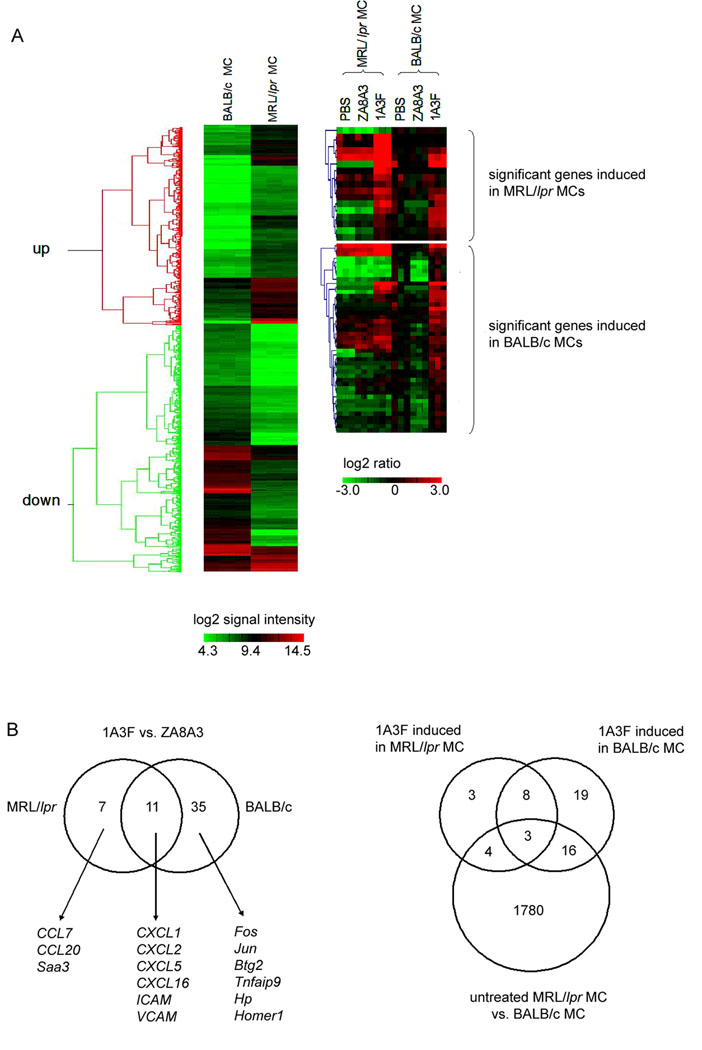
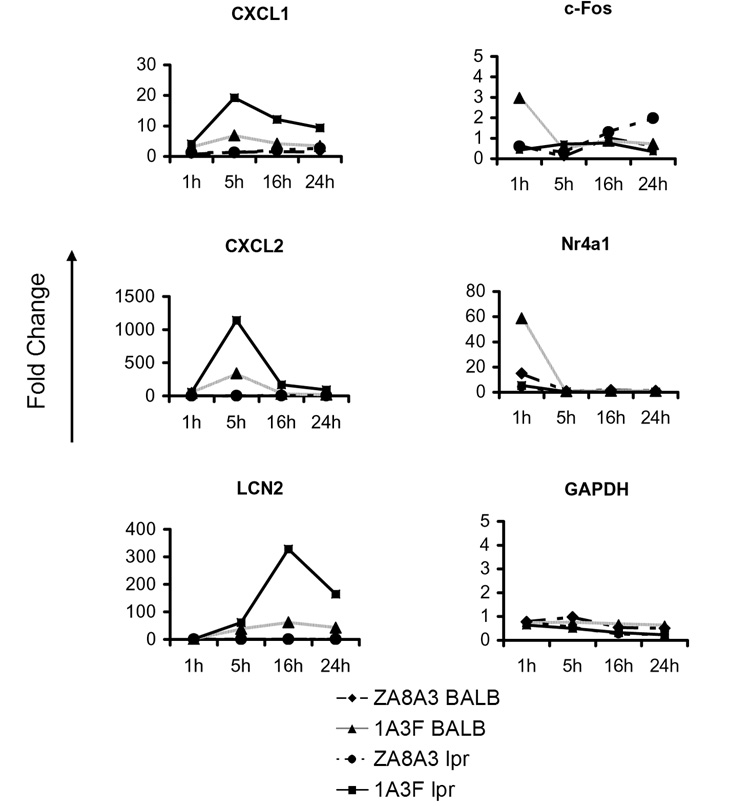
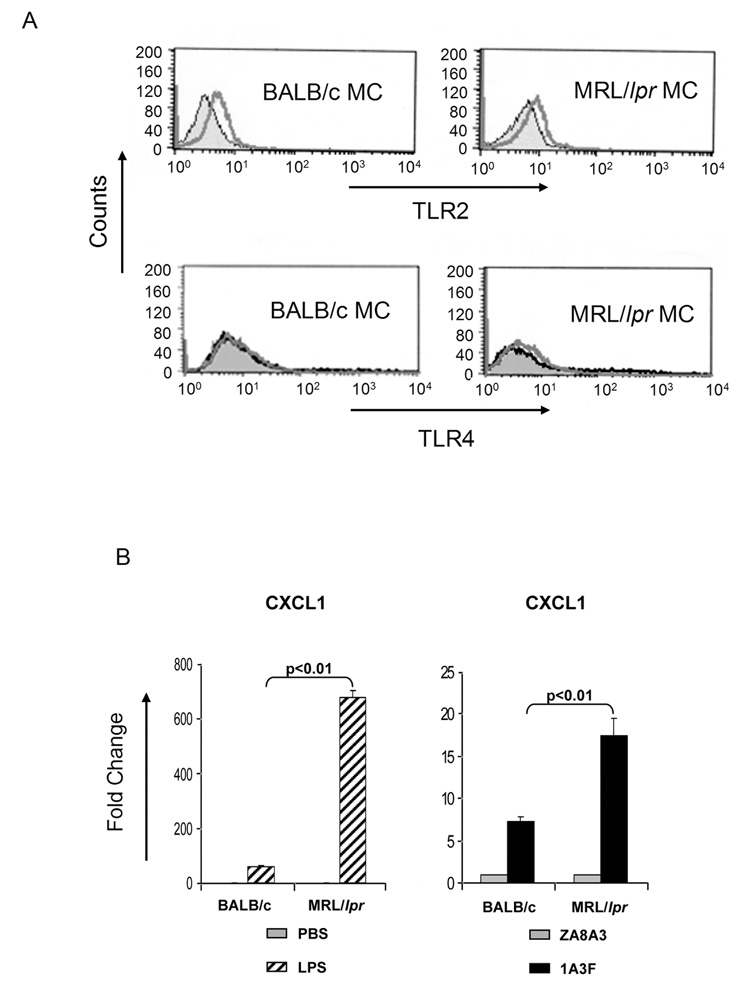
Although anti-DNA antibodies have been decisively linked to the pathogenesis of lupus nephritis, the mechanisms have not been conclusively determined. Recently, we reported that anti-DNA antibodies may contribute to kidney damage by upregulation of proinflammatory genes in mesangial cells (MC), a process involving both Fc receptor-dependent and independent pathways. In investigating the mechanism by which pathogenic anti-DNA antibodies modulate gene expression in MC, we found that the pathogenic anti-DNA antibody 1A3F bound to high mobility group binding protein 1 (HMGB1), an endogenous ligand for TLR2/4 and RAGE (receptor for advanced glycation end products). Interestingly, HMGB1 treatment of MC induced a similar pattern of genes as stimulation with 1A3F. Furthermore, HMGB1 and 1A3F exhibited a synergistic proinflammatory effect in the kidney, where increased expression of HMGB1 was found in lupus patients but not in patients with other types of renal disease. TLR2/Fc and RAGE/Fc inhibited the proinflammatory effects of 1A3F on MC. Finally, we found enhanced susceptibility of lupus prone MRL-lpr/lpr (MRL/lpr) as compared to normal BALB/c derived MC to pathogenic anti-DNA antibody and LPS stimulation (in particular enhanced chemokine synthesis), in addition to significantly increased expression of TLR4. Our results suggest that gene upregulation in MC induced by nephritogenic anti-DNA antibodies is TLR2/4 and RAGE-dependent. Finally, HMGB1 may act as a proinflammatory mediator in antibody-induced kidney damage in systemic lupus erythematosus (SLE).


Figures

Fig. 1
Fig. 1
Pathogenic anti-DNA antibodies bind to HMGB1. (A) HMGB1 was electrophoresed in a 10–20% Tris-Glycine gel, transferred to a PVDF membrane, and immunoblotted with the DNAse pretreated (+) or DNAse untreated (−) monoclonal antibodies indicated in the figure. HMGB1, ZA8A3, 1A3F and the HAP46.5 anti-HMGB1 mAb were pre-treated with DNase I at 37°C for 30 min before blotting. Removal of DNA was confirmed by running the samples on an ethidium bromide stained agarose gel. HMGB1 was blotted as a single band at ~31 kD. (B) Dose dependent binding of 1A3F to HMGB1 as shown by ELISA. Plates coated with HMGB1 (5 µg/ml) were incubated with serially diluted mAb starting at a concentration of 50 µg/ml. ZA8A3 is an anti-DNA negative, non-pathogenic control mAb. The HAP46.5 anti-HMGB1 mAb was used as a positive control. (C) The binding of 1A3F and HAP46.5 to dsDNA is enhanced by pre-incubating the antibody (5 µg/ml) with HMGB1 (1, 5, and 25 µg/ml) at 37°C for 1 h. (D) Measurement of HMGB1 content in the culture medium and purified antibodies by ELISA, as described in Materials and Methods. SF, serum-free mAb culture medium; DME, Dulbecco's modified Eagles medium; plprmc, primary MRL/lpr MCs; ZA8A3/1A3F SF, unpurified hybdridoma culture supernatant; ZA8A3/1A3F purified, affinity purified mAb (* p<0.01). Values on the y-axis in B to D are optical density units @405 nm, and the graphs depict the mean and SD.
Fig. 2
Fig. 2
The 1A3F antibody preparation does not contain DNA. (A) PCR amplification of potential DNA contained in anti-DNA mAb 1A3F. Genomic DNA (0.25 µg) from mouse whole blood, either alone or preincubated with 1A3F or the control mAb ZA8A3 (10 µg/ml) at 37°C for 30 min, was subjected to PCR amplification using primers for the murine gene for complement receptor related protein Crry. The PCR products were analyzed on a 2% agarose gel. (B) 1A3F does not protect DNA from digestion by benzonase. Mouse genomic DNA (0.5 µg) preincubated with or without 1A3F or control mAb was further treated with benzonase (12.5 U) at 37°C for 2 h. The reaction mixtures were analyzed on agarose gels stained with ethidium bromide. (C) 1A3F, ZA8A3 and poly I:C (as a positive control) were pre-treated with benzonase endonuclease for 24 h to degrade all forms of nucleic acids before incubation with MC. Gene expression was then measured by real-time PCR in MCs incubated with antibodies for 6 h. Data displayed here shows one representative experiment of at least 3 independent repeats with similar results. Relative mean fold changes and SD are shown.
Fig. 3
Fig. 3
Pathogenic anti-DNA antibody synergizes with HMGB1 in the induction of proinflammatory responses in kidney cells. MRL/lpr MCs were incubated with HMGB1 (10 µg/ml) or mAb (50 µg/ml), alone (A) or together (B), for 6 h before gene expression was measured by real-time PCR. The gene for Cyclin I (CCNI) was used in A as a control. C, BALB/c mice were injected with 10 µg of HMGB1 intraperitoneally and/or 300 µg of mAb intravenously, 24 h before the kidneys were removed (4 mice per group). Gene induction in the treated cells (A, B) or kidneys (C) was analyzed by real-time PCR. Mean fold changes and SD are shown. D, Serum CXCL1 was measured by ELISA in mice injected with antibody, HMGB1, or both. Values shown represent the mean and SD.
Fig. 4
Fig. 4
TLR2, RAGE, and MyD88 are involved in MC stimulation by HMGB1 and pathogenic anti-DNA antibody. (A) Transfection of MRL/lpr MCs with siRNA targeting at TLR2, MyD88, or a control sequence. Forty-eight hours after transfection, cells were treated with 50 µg/ml of antibody (1A3F and ZA8A3), 10 µg/ml of HMGB1, or 107 cells/ml of HKAL (TLR2 ligand) for 6 h. Transcript levels of iNOS induced in the treated cells were measured by real-time PCR. Data displayed here shows one representative experiment of at least 3 independent repeats with similar results. Mean and SD are shown. (B) MRL/lpr MC express the HMGB1 receptor RAGE. Lysates from C57Bl/6 mouse lung and spleen tissues and MRL/lpr mesangial cells were separated by SDS-PAGE and blotted with rat anti-mouse RAGE antibody. RAGE expression was detected as a band ~50 kD. In lung tissue and MCs, an additional band at ~45 kD was detected. (C) Binding of 1A3F to RAGE and TLR2, as demonstrated by ELISA. Plates were coated with RAGE/Fc or TLR2/Fc (10 µg/ml). Serial dilutions of antibody beginning from 50 µg/ml were applied, and antibody binding detected with goat anti-mouse IgG labeled with alkaline phosphatase. Data displayed here shows one representative experiment of 3 independent repeats with similar results. Values on the y-axis in this Figure are optical density units @405 nm, and the graphs depict the mean and SD. (D) Pathogenic anti-DNA mAb induced gene expression in MCs can be inhibited by blocking antibody binding to RAGE and TLR2. MCs were preincubated with culture medium containing PBS (control), RAGE/Fc or TLR2/Fc at 10 µg/ml for 1 h. PBS, 1A3F (100 µg/ml), or HMGB1 (10 µg/ml) was then added to the culture for 6 h. Real-time PCR was performed to analyze the expression of iNOS in treated MCs. Data displayed here shows one representative experiment of 3 independent repeats with similar results. Mean and SD are shown (* p<0.05 vs. PBS treatment).
Fig. 5
Fig. 5
Increased expression of HMGB1 in kidneys of lupus patients. Representative immunohistochemical staining of HMGB1 in the kidney from three lupus patients with WHO class III (patient 4), IV (patient 8), and V (patient 3) nephritis (A, B, E, F) and normal controls (C, D, G, H). Intrinsic renal cells and infiltrates of mononuclear cells from lupus patients exhibited significantly increased cytoplasmic (black arrow) (E), nuclear (black arrow head) (F) and extracellular (white arrow) (F) expression of HMGB1. pt, patient; n, normal control. (Magnification, A-D, 10x; E-L, 40×). (I,J,K,L) Immunohistochemistry analysis of HMGB1 expression in non-SLE diseased kidneys compared to lupus kidneys with nephritis. Kidney paraffin sections from normals, patients with lupus nephritis (Class IV), diabetic nephropathy, and acute tubular necrosis (2 subjects in each group) were stained for the expression of HMGB1 using biotin labeled anti-HMGB1 antibody. HMGB1 staining appears as a dark brown color. Sections were counter stained with hematoxylin in blue. The kidneys from patients with lupus nephritis exhibited strong staining for HMGB1; kidneys with acute tubular necrosis (ATN) showed only minimal HMGB1 expression in the cytoplasm of tubular cells. Both diabetic and normal kidneys are negative for extranuclear HMGB1 staining. Shown here are representative images from each disease category.
Fig. 6
Fig. 6
MCs from lupus prone MRL/lpr and normal BALB/c mice respond differently to pathogenic antibody stimulation. (A) Hierarchical clustering analysis of differentially expressed genes identified by microarray. Left panel shows the comparison of untreated cells. Significantly differentially expressed genes were selected for hierarchical clustering analysis (p<0.001, fold change >3). Colors in the picture represent log2 transformed intensity of signals. Right panel illustrates transcripts induced by the nephritogenic antibody 1A3F in MRL/lpr MCs versus BALB/c MCs. Cells were treated with 1A3F or the control antibody ZA8A3 at 50 µg/ml or PBS, for 6 h. Differentially expressed genes were selected for hierarchical clustering analysis (p<0.05, fold change >2). Colors in the right panels represent log2 transformed ratio of signals (antibody against PBS treatment). There are three biological replicates (independent experiments) in each group. (B) Venn diagram of transcripts induced by 1A3F in MRL/lpr MC and BALB/c MC (left). In the right panel, a Venn diagram of transcripts induced by 1A3F in MRL/lpr MC and BALB/c MC compared to differentially expressed transcripts in untreated MCs is shown.
Fig. 7
Fig. 7
Real-time PCR confirmation of differentially expressed genes induced by pathogenic antibody in MRL/lpr MCs and BALB/c MCs. Cells were treated with PBS, ZA8A3 or 1A3F at 50 µg/ml for 1, 5, 16, and 24 h. Gene expression was analyzed by real-time PCR. GAPDH is shown as a control gene. CXCL5, CCL7, CCL20, VCAM-1, and MCP-1 also displayed up to 50 fold higher gene expression levels at the 5 or 16 hour time points in MRL/lpr as compared to BALB/c MC following stimulation by 1A3F (data not shown). Data displayed here shows one representative experiment of at least 3 independent repeats with similar results.
Fig. 8
Fig. 8
Differential expression of TLRs between MRL/lpr and BALB/c MCs. (A) Both TLR2 and TLR4 were detected in unstimulated MRL/lpr MCs, while only TLR2 was found on the cell surface of BALB/c MCs. Filled histogram, PBS; open lines, corresponding antibody. (B) MCs from the lupus prone MRL/lpr background are hyperresponsive to stimulation by LPS (left panel) and pathogenic antibody (right panel) as compared to MC from normal BALB/c mice. Cells were treated with LPS at 10 µg/ml or mAb at 50 µg/ml for 6 h. The induction of CXCL1 was analyzed by real-time PCR. Data displayed here shows one representative experiment of at least 2 independent repeats with similar results. Mean and SD are shown.

References

    1. Foster MH, Cizman B, Madaio MP. Nephritogenic autoantibodies in systemic lupus erythematosus: immunochemical properties, mechanisms of immune deposition, and genetic origins. Lab Invest. 1993;69:494–507. - PubMed
    1. Hahn BH. Antibodies to DNA. N Engl J Med. 1998;338:1359–1368. - PubMed
    1. Liang Z, Xie C, Chen C, Kreska D, Hsu K, Li L, et al. Pathogenic profiles and molecular signatures of antinuclear autoantibodies rescued from NZM2410 lupus mice. J Exp Med. 2004;199:381–398. - PMC - PubMed
    1. Clynes R, Dumitru C, Ravetch JV. Uncoupling of immune complex formation and kidney damage in autoimmune glomerulonephritis. Science. 1998;279:1052–1054. - PubMed
    1. Fu Y, Xie C, Chen J, Zhu J, Zhou H, Thomas J, et al. Innate stimuli accentuate end-organ damage by nephrotoxic antibodies via Fc receptor and TLR stimulation and IL-1/TNF-alpha production. J Immunol. 2006;176:632–639. - PubMed

Publication types

MeSH terms