Carr-Purcell-Meiboom-Gill imaging of prostate cancer: quantitative T2 values for cancer discrimination
- PMID: 18823731
- PMCID: PMC2720831
- DOI: 10.1016/j.mri.2008.08.001
Carr-Purcell-Meiboom-Gill imaging of prostate cancer: quantitative T2 values for cancer discrimination
Abstract
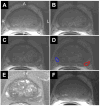
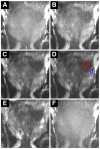
Quantitative, apparent T(2) values of suspected prostate cancer and healthy peripheral zone tissue in men with prostate cancer were measured using a Carr-Purcell-Meiboom-Gill (CPMG) imaging sequence in order to assess the cancer discrimination potential of tissue T(2) values. The CPMG imaging sequence was used to image the prostates of 18 men with biopsy-proven prostate cancer. Whole gland coverage with nominal voxel volumes of 0.54 x 1.1 x 4 mm(3) was obtained in 10.7 min, resulting in data sets suitable for generating high-quality images with variable T(2)-weighting and for evaluating quantitative T(2) values on a pixel-by-pixel basis. Region-of-interest analysis of suspected healthy peripheral zone tissue and suspected cancer, identified on the basis of both T(1)- and T(2)-weighted signal intensities and available histopathology reports, yielded significantly (P<.0001) longer apparent T(2) values in suspected healthy tissue (193+/-49 ms) vs. suspected cancer (100+/-26 ms), suggesting potential utility of this method as a tissue specific discrimination index for prostate cancer. We conclude that CPMG imaging of the prostate can be performed in reasonable scan times and can provide advantages over T(2)-weighted fast spin echo (FSE) imaging alone, including quantitative T(2) values for cancer discrimination as well as proton density maps without the point spread function degradation associated with short effective echo time FSE sequences.
Figures


References
-
- Cancer facts and figures. American Cancer Society. 2007. www.cancer.org.
-
- Presti JC., Jr Prostate cancer: Assessment of risk using digital rectal examination, tumor grade, prostate-specific antigen, and systematic biopsy. Radiol Clin North Am. 2000;38:49–58. - PubMed
-
- Yu KK, Hricak H. Imaging prostate cancer. Radiol Clin North AM. 2000;38:59–85. - PubMed
-
- Szot Barnes A, Haker SJ, Mulkern RV, So M, D’Amico AV, Tempany CM. Magnetic resonance spectroscopy-guided transperineal prostate biopsy and brachytherapy for recurrent prostate cancer. Urology. 2005;66:1319.e13–1319.e15. - PubMed
-
- Poissonnier L, Chapelon JY, Rouviere O, Curiel L, Bouvier R, Martin X, Dubernard JM, Gelet A. Control of prostate cancer by transrectal HIFU in 227 patients. European Urology. 2007;51:381–387. - PubMed
Publication types
MeSH terms
Grants and funding
LinkOut - more resources
Full Text Sources
Other Literature Sources
Medical

