. 2009 Feb;57(2):91-100.
doi: 10.1369/jhc.2008.952143. Epub 2008 Sep 29.

Chondrocyte phenotype and ectopic ossification in collagenase-induced tendon degeneration

Affiliations

Chondrocyte phenotype and ectopic ossification in collagenase-induced tendon degeneration

Pauline Po-yee Lui et al. J Histochem Cytochem. 2009 Feb.

Abstract

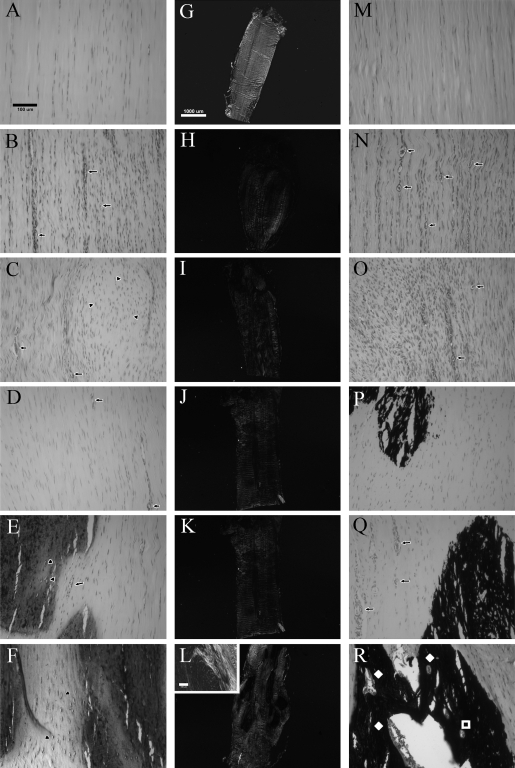
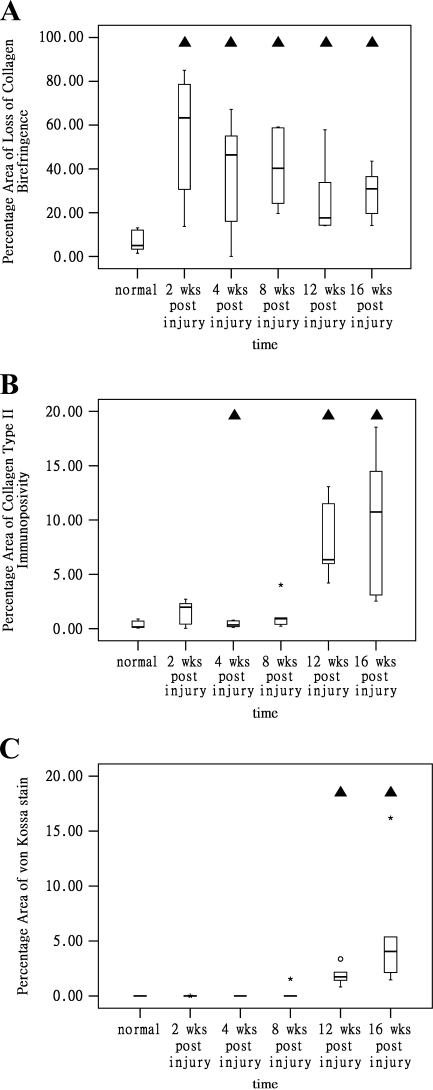
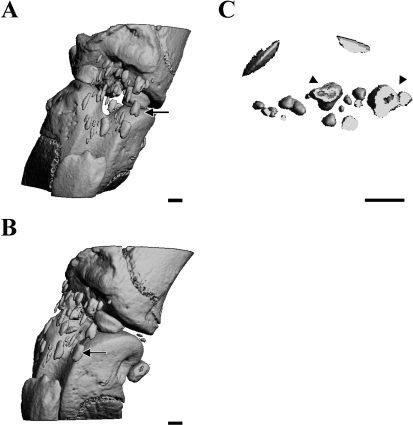
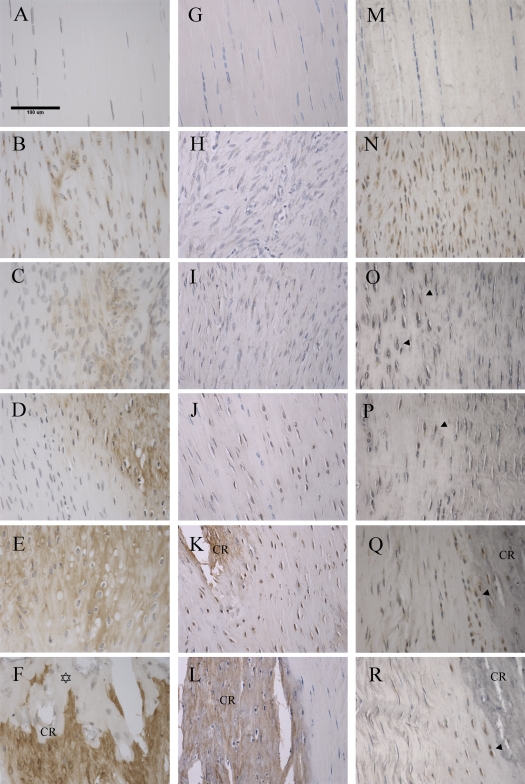
We report chondrocyte phenotype and ectopic ossification in a collagenase-induced patellar tendon injury model. Collagenase or saline was injected intratendinously in one limb. The patella tendon was harvested for assessment at different times. There was an increase in cellularity, vascularity, and loss of matrix organization with time after collagenase injection. The tendon did not heal histologically until week 32. Ectopic mineralization as indicated by von Kossa staining started from week 8. Tendon calcification was mediated by endochondral ossification, as shown by expression of type X collagen. viva CT imaging and polarization microscopy showed characteristic bony porous structures and collagen fiber arrangement, respectively, in the calcific regions. Marrow-like cells and blood vessels were observed inside calcific deposits. Chondrocyte-like cells as indicated by morphology, expression of type II collagen, and sox 9 were seen around and embedded inside the calcific deposits. Fibroblast-like cells expressed type II collagen and sox 9 at earlier times, suggesting that erroneous differentiation of healing tendon fibroblasts may account for failed healing and ossification in collagenase-induced tendon degeneration. Because this animal model replicates key histopathological changes in calcific tendinopathy, it can be used as a model for the study of its pathogenesis at the patellar tendon.


Figures

Figure 1
Figure 1
Representative images of histological, polarization, and von Kossa staining of patella tendon at different times after intratendinous collagenase injection. (A–F) Hematoxylin–eosin staining. After intratendinous collagenase injection, the cell density and vascularity increased with time, with a transient decrease at week 8. The condition deteriorated with an increase in cell density and vasculature at weeks 12 and 16. Chondrocyte-like cells first appeared at week 4, and they surrounded calcific deposits starting at week 8. Calcific deposits were present in all samples at week 12 and increased in size at week 16. There was no sign of infiltration of inflammatory cells. These changes were not observed in the saline injection control. (G–L) Polarization microscopy. There was progressive loss of collagen birefringence with time compared with that in the saline injection control. Focal loss of collagen birefringence occurred at weeks 12 and 16. Trabecular-like collagen fiber alignment was observed in the calcific deposits in some specimens at week 16 (inset). The extracellular matrix of the saline injection control remained intact as indicated by high collagen birefringence. (M–R) von Kossa staining. Mineralized matrix was observed starting from week 8. There was no staining in the saline injection control. Note the presence of marrow-like structures (diamond) and blood vessels (rectangle) within the calcific deposit at week 16. The saline injection control as follows: week 16, A,G,M; week 2, B,H,N; week 4, C,I,O; week 8, D,J,P; week 12, E,K,Q; week 16, F,L,R. Arrow, blood vessels; arrowhead, chondrocyte-like cells; diamond, marrow-like cells inside calcific deposit; rectangle, blood vessels inside calcific deposit. Bars: A–F,M–R,inset = 100 μm; G–L = 1000 μm.
Figure 2
Figure 2
(A) Graph showing percentage area of loss of collagen birefringence at different times after intratendinous collagenase injection. There was significant loss of collagen birefringence at all time points compared with saline control. (B) Graph showing percentage area of type II collagen immunopositive stain at different times after intratendinous collagenase injection. There was significantly higher percentage area of type II collagen immunopositivity at weeks 12 and 16 compared with the saline control. (C) Graph showing percentage area of von Kossa stain at different times after intratendinous collagenase injection. There was a significantly higher percentage area of von Kossa staining at weeks 12 and 16 compared with that in the control. Triangle indicates p<0.05 in post hoc comparison compared with the saline injection normal control.
Figure 3
Figure 3
Representative viva CT images of calcific deposits inside the tendon at week 32 after intratendinous collagenase injection. Note the localization of calcific deposits (arrow) in the tendon. Note the porous structures of the calcific deposits (arrowhead). (A) Anterior-posterior view. (B) Oblique view. (C) Calcific deposit at higher magnification. Bar = 1 mm.
Figure 4
Figure 4
Representative IHC images of the patella tendon at different times after intratendinous collagenase injection. (A–F) IHC of type II collagen. Immunopositivity was first observed at week 2 in tendon cells. There was intense staining of the chondrocyte-like cells and their surrounding matrix close to the calcific regions at weeks 8, 12, and 16. The tendon cells were not stained. The central part of the calcific deposit was not stained in some specimens at week 16 (star). There was no expression of type II collagen in the saline injection control. (G–L) IHC of type X collagen. Immunopositivity was observed in chondrocyte-like cells at week 8, some calcific deposits and their surrounding chondrocyte-like cells at week 12, and all calcific deposits and their surrounding chondrocyte-like cells at week 16. There was no expression of type X collagen in the saline injection control. (M–R) IHC of sox 9. There was strong expression of sox 9 in tendon cells in high cell density region at week 2. At weeks 4 and 8, a weak signal was also observed in some chondrocyte-like cells. At weeks 12 and 16, chondrocyte-like cells surrounding calcific deposits were stained, and the intensity was higher at week 12 compared with that at week 16. There was no expression of sox 9 in the saline injection control. Saline injection controls: week 16, A,G,M; week 2, B,H,N; week 4, C,I,O; week 8, D,J,P; week 12, E,K,Q; week 16, F,L,R. Arrowhead, chondrocyte-like cells; star, clear zone of calcific deposit; CR, calcific region.

References

    1. Archambault JM, Jelinsky SA, Lake SP, Hill AA, Glaser DL, Soslowsky LJ (2007) Rat supraspinatus tendon expresses cartilage makers with overuse. J Orthop Res 25:617–624 - PubMed
    1. Archer RS, Bayley JIL, Archer CW, Ali SY (1993) Cell and matrix changes associated with pathological calcification of the human rotator cuff tendons. J Anat 182:1–12 - PMC - PubMed
    1. Bi Y, Ehirchiou D, Kilts TM, Kilts TM, Inkson CA, Embree MC, Sonoyama W, et al. (2007) Identification of tendon stem / progenitor cells and the role of the extracellular matrix in their niche. Nat Med 13:1219–1227 - PubMed
    1. Chard MD, Cawston TE, Rilely GP, Gresham GA, Hazleman BL (1994) Rotator cuff degeneration and lateral epicondylitis – a comparative histological study. Ann Rheum Dis 53:30–34 - PMC - PubMed
    1. Chen YJ, Wang CJ, Yang KD, Kuo YR, Huang HC, Huang YT, Sun YC, et al. (2004) Extracorporeal shock waves promote healing of collagenase-induced Achilles tendinitis and increase TGF-beta1 and IGF-I expression. J Orthop Res 22:854–861 - PubMed

Publication types