

Dynamic contrast-enhanced magnetic resonance imaging pharmacodynamic biomarker study of sorafenib in metastatic renal carcinoma
- PMID: 18824708
- PMCID: PMC2736992
- DOI: 10.1200/JCO.2007.15.5655
Dynamic contrast-enhanced magnetic resonance imaging pharmacodynamic biomarker study of sorafenib in metastatic renal carcinoma
Abstract
Purpose: Sorafenib is an antiangiogenic agent with activity in renal cancer. We conducted a randomized trial to investigate dynamic contrast magnetic resonance imaging (DCE-MRI) as a pharmacodynamic biomarker.
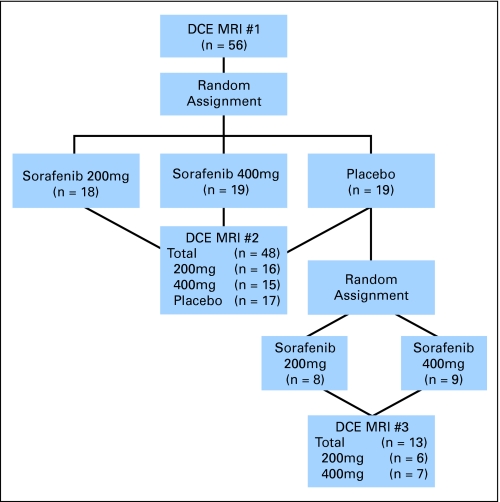
Patients and methods: Patients were randomly assigned to placebo or 200 or 400 mg twice per day of sorafenib. DCE-MRI was performed at baseline and 4 weeks. DCE-MRI parameters, area under the contrast concentration versus time curve 90 seconds after contrast injection (IAUC(90)), and volume transfer constant of contrast agent (K(trans)) were calculated for a metastatic site selected in a blinded manner. Primary end point was change in K(trans).
Results: Of the 56 assessable patients, 48 underwent two MRIs; 44 MRIs were assessable for study end points. Mean K(trans) log ratios were 0.131 (standard deviation [SD], 0.315), -0.148 (SD, 0.382), -0.271 (SD, 0.499) in placebo, 200- and 400-mg cohorts, respectively (P = .0077 for trend) corresponding to changes of +14%, -14%, and -24%. IAUC(90) log ratios were 0.041 (SD, 0.197), -0.040 (SD, 0.132), -0.356 (SD, 0.411), respectively (P = .0003 for trend), corresponding to changes of +4%, -4%, and -30%. Using a log-rank test, IAUC(90) and K(trans) changes were not associated with progression-free survival (PFS). Patients with high baseline K(trans) had a better PFS (P = .027).
Conclusion: IAUC(90) and K(trans) are pharmacodynamic biomarkers for sorafenib, but variability is high and magnitude of effect is less than previously reported. Changes in DCE-MRI parameters after 4 weeks of sorafenib are not predictive of PFS, suggesting that these biomarkers are not surrogate end points. The value of baseline K(trans) as a prognostic or predictive biomarker requires additional study.
Figures


References
-
- Escudier B, Koralewski P, Pluzanska A, et al: A randomized, controlled, double-blind phase III study (AVOREN) of bevacizumab/interferon-α2a vs placebo/interferon- α2a as first-line therapy in metastatic renal cell carcinoma. J Clin Oncol 25:2s, 2007. (suppl; abstr 3),
-
- Escudier B, Eisen T, Stadler WM, et al: Sorafenib in advanced clear-cell renal-cell carcinoma. N Engl J Med 356:125-134, 2007 - PubMed
-
- Motzer RJ, Hutson TE, Tomczak P, et al: Sunitinib versus interferon alfa in metastatic renal-cell carcinoma. N Engl J Med 356:115-124, 2007 - PubMed
-
- Padhani AR: Dynamic contrast-enhanced MRI in clinical oncology: Current status and future directions. J Magn Reson Imaging 16:407-422, 2002 - PubMed
Publication types
MeSH terms
Substances
Grants and funding
LinkOut - more resources
Full Text Sources
Medical
