

Ability of pulse power, esophageal Doppler, and arterial pulse pressure to estimate rapid changes in stroke volume in humans
- PMID: 18824912
- PMCID: PMC2586847
- DOI: 10.1097/CCM.0b013e31818b31f0
Ability of pulse power, esophageal Doppler, and arterial pulse pressure to estimate rapid changes in stroke volume in humans
Abstract
Introduction: Measures of arterial pulse pressure variation and left ventricular stroke volume variation induced by positive-pressure breathing vary in proportion to preload responsiveness. However, the accuracy of commercially available devices to report dynamic left ventricular stroke volume variation has never been validated.
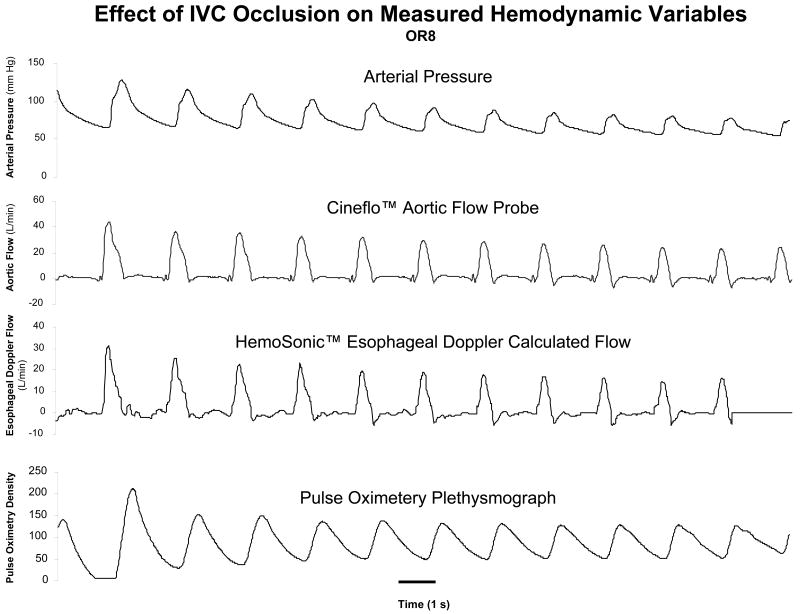
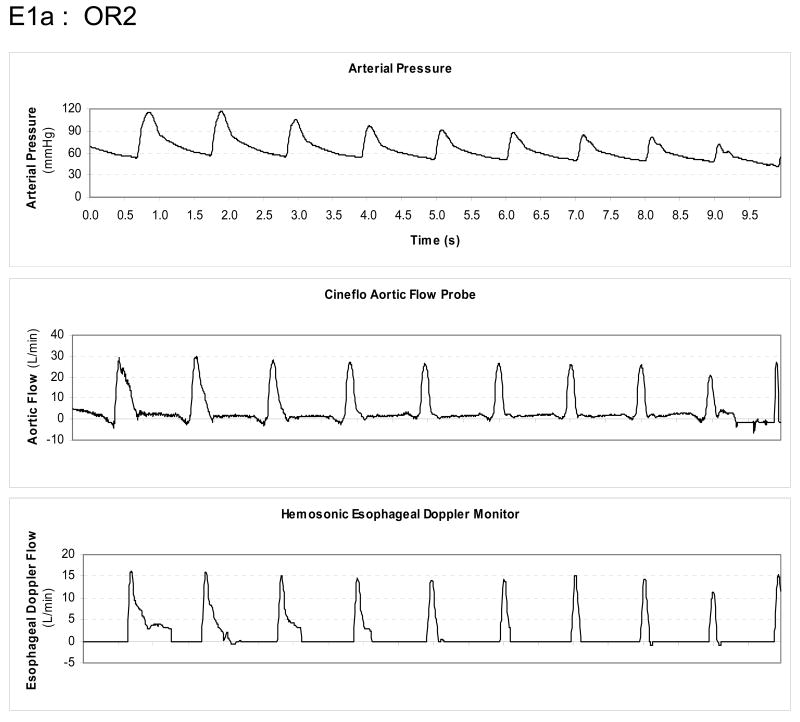
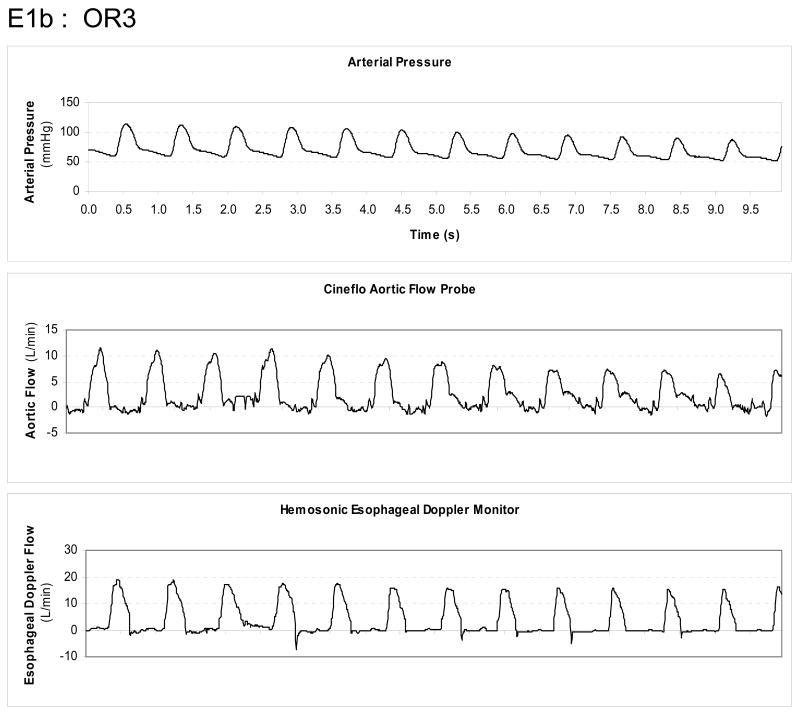
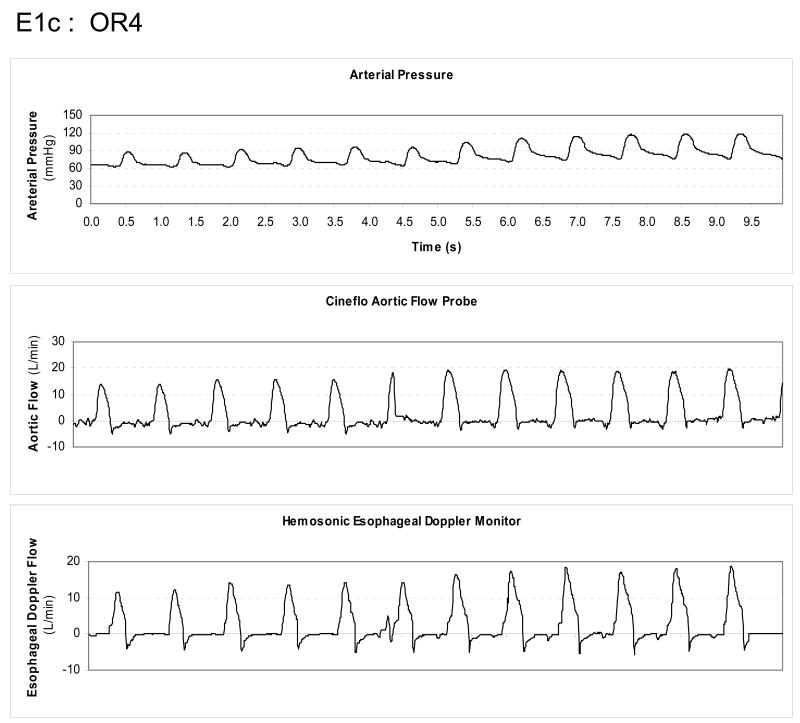
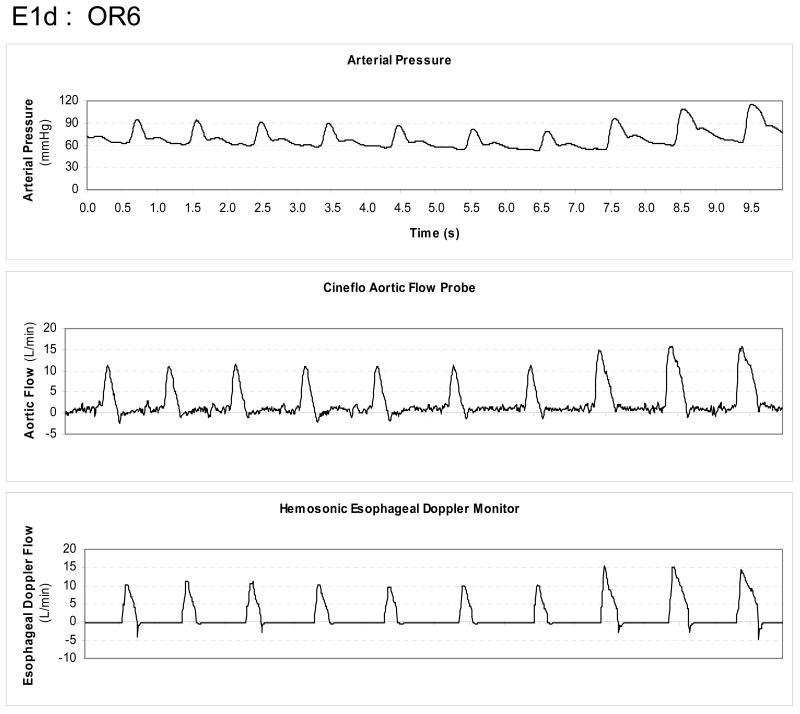
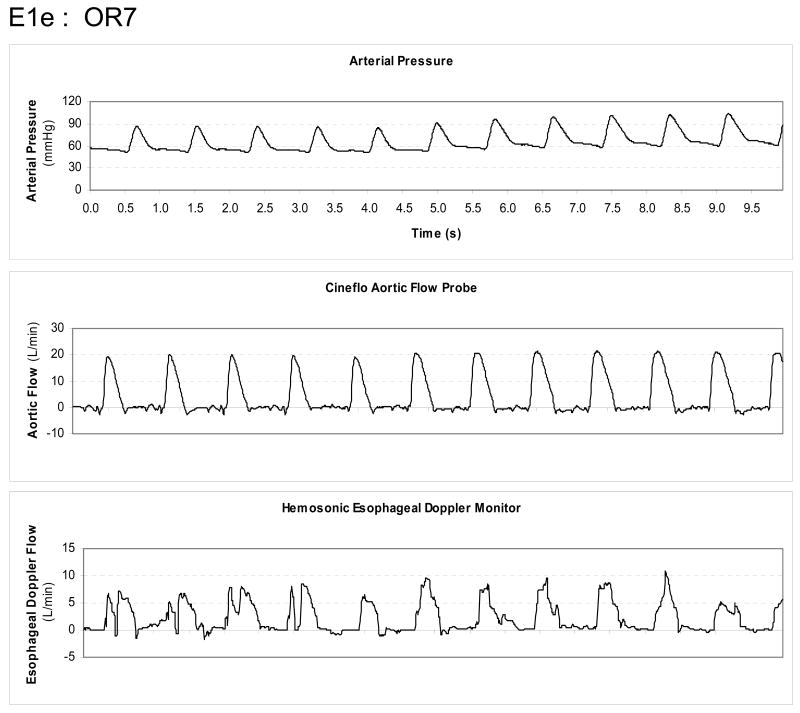
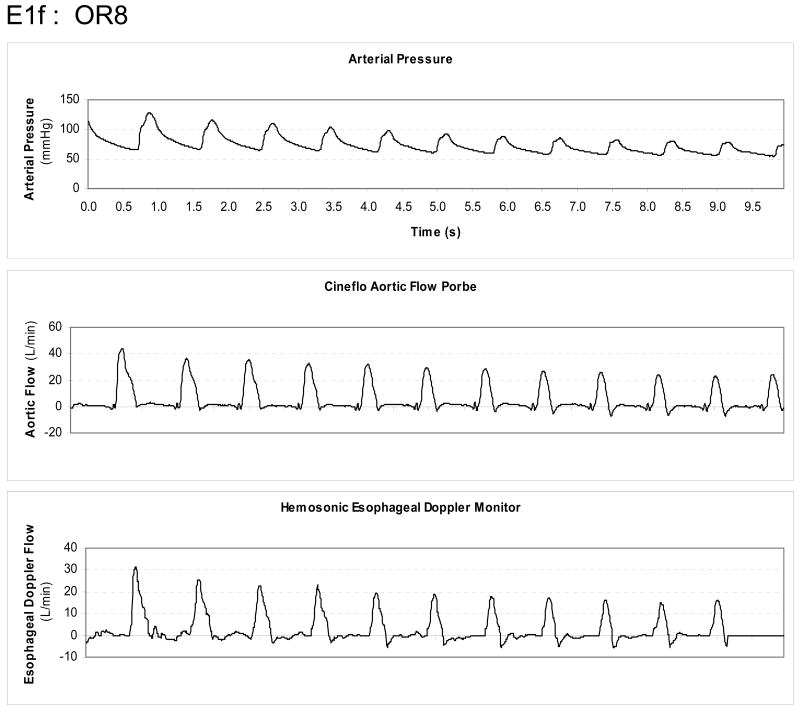
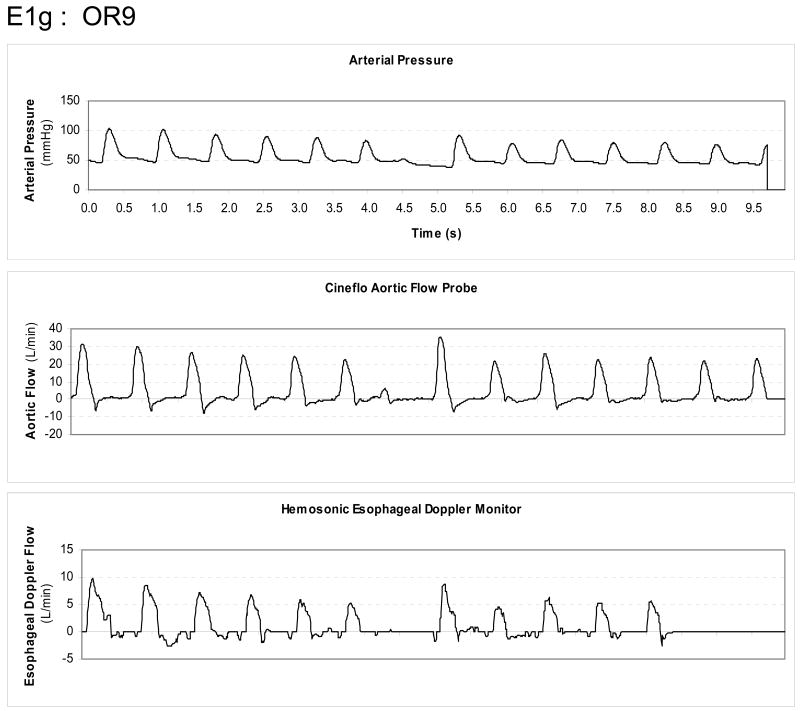
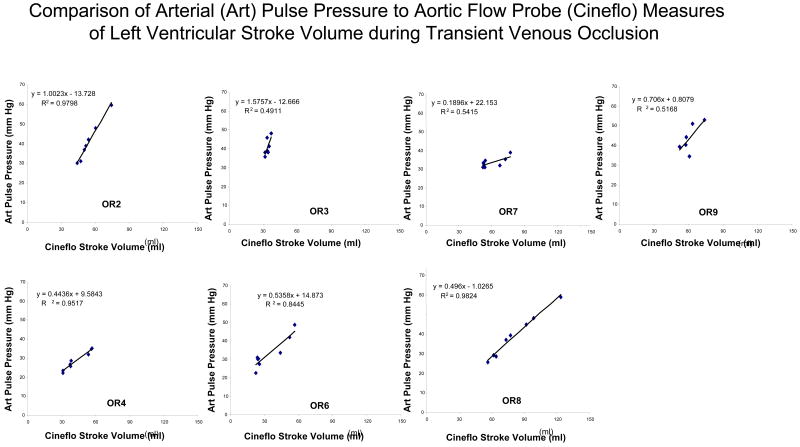
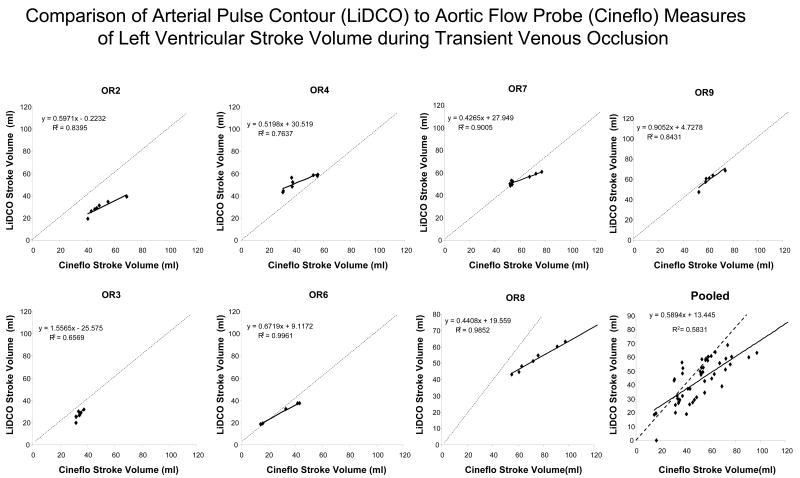
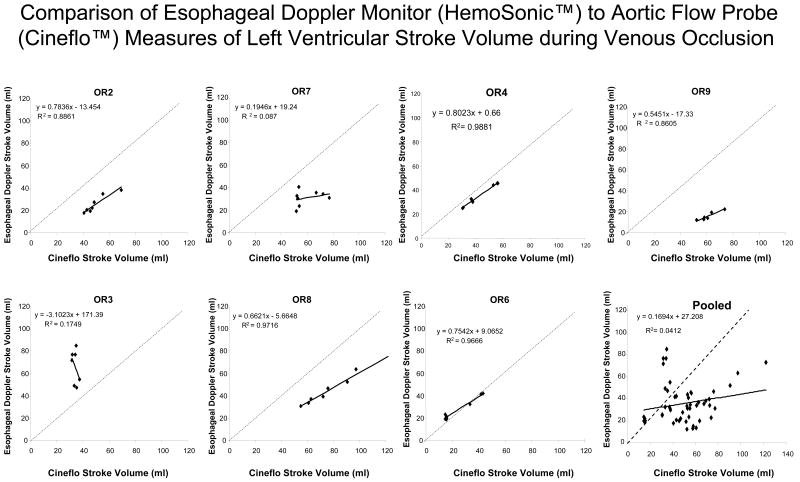
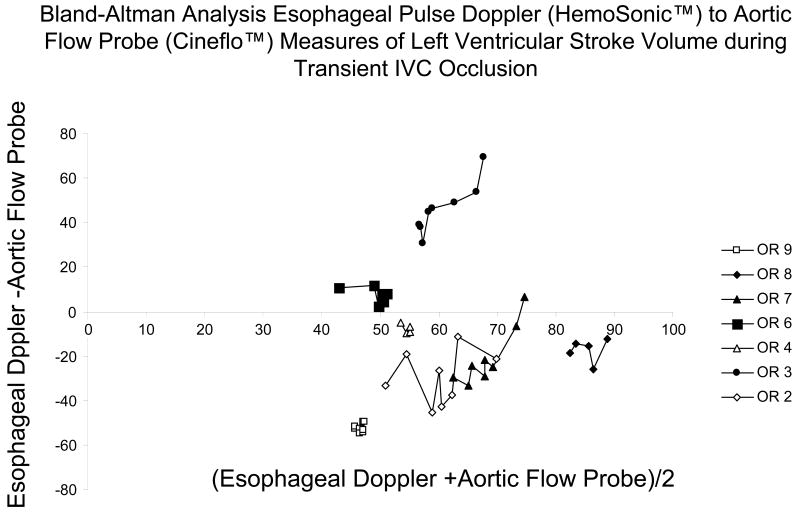
Methods: We compared the accuracy of measured arterial pulse pressure and estimated left ventricular stroke volume reported from two Food and Drug Administration-approved aortic flow monitoring devices, one using arterial pulse power (LiDCOplus) and the other esophageal Doppler monitor (HemoSonic). We compared estimated left ventricular stroke volume and their changes during a venous occlusion and release maneuver to a calibrated aortic flow probe placed around the aortic root on a beat-to-beat basis in seven anesthetized open-chested cardiac surgery patients.
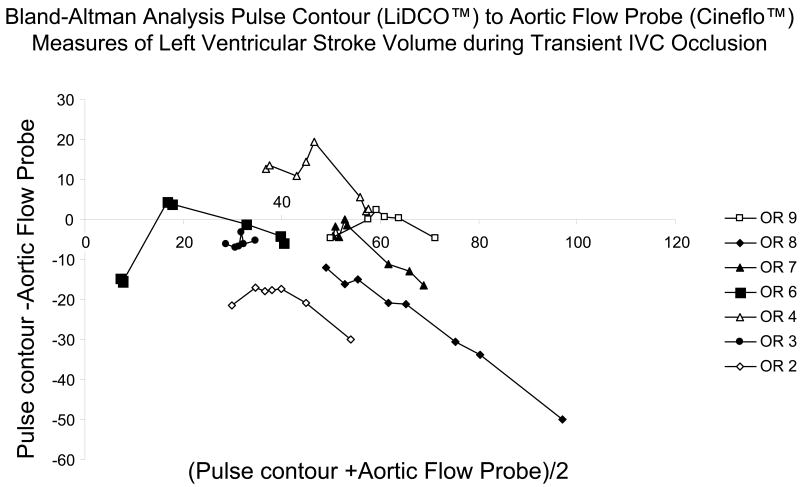
Results: Dynamic changes in arterial pulse pressure closely tracked left ventricular stroke volume changes (mean r .96). Both devices showed good agreement with steady-state apneic left ventricular stroke volume values and moderate agreement with dynamic changes in left ventricular stroke volume (esophageal Doppler monitor -1 +/- 22 mL, and pulse power -7 +/- 12 mL, bias +/- 2 sd). In general, the pulse power signals tended to underestimate left ventricular stroke volume at higher left ventricular stroke volume values.
Conclusion: Arterial pulse pressure, as well as, left ventricular stroke volume estimated from esophageal Doppler monitor and pulse power reflects short-term steady-state left ventricular stroke volume values and tract dynamic changes in left ventricular stroke volume moderately well in humans.
Conflict of interest statement
Figures
Comment in
-
How good is arterial pulse contour (LiDCO) and the esophageal Doppler monitor (HemoSonic) in measuring left ventricular stroke volume during venous occlusion?Crit Care Med. 2008 Nov;36(11):3103-4. doi: 10.1097/CCM.0b013e31818b927a. Crit Care Med. 2008. PMID: 18941314 No abstract available.
Similar articles
-
Ability of pulse contour and esophageal Doppler to estimate rapid changes in stroke volume.Intensive Care Med. 2006 Oct;32(10):1537-46. doi: 10.1007/s00134-006-0284-5. Epub 2006 Jul 28. Intensive Care Med. 2006. PMID: 16874496
-
Comparison of pulse contour, aortic Doppler ultrasound and bioelectrical impedance estimates of stroke volume during rapid changes in blood pressure.Exp Physiol. 2019 Mar;104(3):368-378. doi: 10.1113/EP087240. Epub 2019 Jan 27. Exp Physiol. 2019. PMID: 30582758
-
Limitations of arterial pulse pressure variation and left ventricular stroke volume variation in estimating cardiac pre-load during open heart surgery.Acta Anaesthesiol Scand. 2007 Oct;51(9):1258-67. doi: 10.1111/j.1399-6576.2007.01423.x. Epub 2007 Aug 20. Acta Anaesthesiol Scand. 2007. PMID: 17714575
-
Validation of pulse contour derived stroke volume variation during modifications of cardiac afterload.Br J Anaesth. 2007 May;98(5):591-7. doi: 10.1093/bja/aem062. Br J Anaesth. 2007. PMID: 17456489
-
Using heart-lung interactions to assess fluid responsiveness during mechanical ventilation.Crit Care. 2000;4(5):282-9. doi: 10.1186/cc710. Epub 2000 Sep 1. Crit Care. 2000. PMID: 11094507 Free PMC article. Review.
Cited by
-
Abdominal compartment syndrome: risk factors, diagnosis, and current therapy.Crit Care Res Pract. 2012;2012:908169. doi: 10.1155/2012/908169. Epub 2012 Jun 7. Crit Care Res Pract. 2012. PMID: 22720147 Free PMC article.
-
Cardiac output in idiopathic normal pressure hydrocephalus: association with arterial blood pressure and intracranial pressure wave amplitudes and outcome of shunt surgery.Fluids Barriers CNS. 2011 Feb 4;8(1):11. doi: 10.1186/2045-8118-8-11. Fluids Barriers CNS. 2011. PMID: 21349148 Free PMC article.
-
Regional perfusion during venoarterial extracorporeal membrane oxygenation: a case report and educational modules on the concept of dual circulations.J Extra Corpor Technol. 2013 Sep;45(3):187-94. J Extra Corpor Technol. 2013. PMID: 24303602 Free PMC article.
-
Electrical impedance tomography in perioperative medicine: careful respiratory monitoring for tailored interventions.BMC Anesthesiol. 2019 Aug 7;19(1):140. doi: 10.1186/s12871-019-0814-7. BMC Anesthesiol. 2019. PMID: 31390977 Free PMC article. Review.
-
Invasive arterial pressure monitoring: much more than mean arterial pressure!Intensive Care Med. 2022 Oct;48(10):1495-1497. doi: 10.1007/s00134-022-06798-8. Epub 2022 Jul 8. Intensive Care Med. 2022. PMID: 35802139 Review. No abstract available.
References
-
- Michard F, Boussat S, Chemla D, et al. Relation between respiratory changes in arterial pulse pressure and fluid responsiveness in septic patients with acute circulatory failure. Am J Respir Crit Care Med. 2000;162:134–138. - PubMed
-
- Michard F, Chemla D, Richard C, et al. Clinical use of respiratory changes in arterial pulse pressure to monitor the hemodynamic effects of PEEP. Am J Respir Crit Care Med. 1999;159:935–939. - PubMed
-
- Feissel M, Michard F, Mangin I, et al. Respiratory changes in aortic blood velocity as an indicator of fluid responsiveness in ventilated patients with septic shock. Chest. 2001;119:867–873. - PubMed
-
- Monnet X, Rienzo M, Osman D, et al. Response to leg raising predicts fluid responsiveness during spontaneous breathing or with arrhythmia. Crit Care Med. 2006;34:1402–1407. - PubMed
-
- Godje O, Thiel C, Lam MP, et al. Less invasive, continuous hemodynamic monitoring during minimally invasive coronary surgery. Ann Thorac Surg. 1999;68:1532–1536. - PubMed
Publication types
MeSH terms
Grants and funding
LinkOut - more resources
Full Text Sources
Medical
