Modulation of aquaporin-2/vasopressin2 receptor kidney expression and tubular injury after endotoxin (lipopolysaccharide) challenge
- PMID: 18824919
- PMCID: PMC2745282
- DOI: 10.1097/CCM.0b013e318186a938
Modulation of aquaporin-2/vasopressin2 receptor kidney expression and tubular injury after endotoxin (lipopolysaccharide) challenge
Abstract
Objective: Sepsis-induced organ dysfunctions remain prevalent and account for >50% of intensive care unit admissions for acute renal failure with a mortality rate nearing 75%. In addition to the fact that the mechanisms underlying the pathophysiology of sepsis-related acute renal failure are unclear, the impact on septic-induced acute renal failure of either norepinephrine, a gold-standard vasopressor, and arginine vasopressin, a candidate alternative, are not well understood.
Design: Randomized and controlled in vivo study.
Setting: Research laboratory and animal facilities.
Subjects: Adult rats treated with endotoxin (lipopolysaccharide) and/or vasopressors.
Interventions: Rats were intraperitoneally injected with lipopolysaccharide (12 mg/kg) or saline and then infused with either saline, 0.375 microg/microL arginine vasopressin, or 32.5 microg/microL norepinephrine for 18 hrs. These vasopressor rates yielded respective targeted blood levels observed in human septic shock.
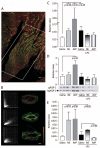
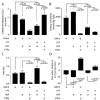
Measurements and main results: Renal function, including glomerular filtration rate and fraction, renal blood flow, aquaporin-2, and arginine vasopressin-2 (V2 receptor) networking, water and salt handling, and urinary protein excretion, were evaluated. After lipopolysaccharide challenge arginine vasopressin infusion: 1) impaired creatinine clearance without affecting renal blood flow, glomerular filtration rate, and fraction but reduced free-water clearance, both of which being partially restored by the V2 receptor antagonist SR-121463B; 2) decreased the recognized ability of arginine vasopressin alone to recruit aquaporin-2 to the apical membrane increase its mRNA expression and urinary release; 3) increased urinary protein content but decreased specific kidney injury molecule-1, and Clara cell protein-16 release (p < 0.05 vs. lipopolysaccharide alone). Conversely, norepinephrine infusion did not add to lipopolysaccharide-induced alteration of urine biochemistry, except for improved creatinine clearance and increased microalbuminuria.
Conclusion: In this endotoxic model, dose-targeted arginine vasopressin infusion increased lipopolysaccharide-induced renal dysfunction without affecting renal blood flow and glomerular function, but with particular disruption of aquaporin-2/V2 receptor networking, consecutive decreased salt and water handling ability. This is in clear contrast with norepinephrine infusion and suggests specific arginine vasopressin-induced "tubular epithelial dysfunction."
Figures


Comment in
-
Vasopressin and the kidney: two false friends?Crit Care Med. 2008 Nov;36(11):3111-2. doi: 10.1097/CCM.0b013e318187b7b3. Crit Care Med. 2008. PMID: 18941319 No abstract available.
Similar articles
-
Acute renal response to the non-peptide vasopressin V2-receptor antagonist SR 121463B in anesthetized rats.Naunyn Schmiedebergs Arch Pharmacol. 2000 Sep;362(3):201-7. doi: 10.1007/s002100000282. Naunyn Schmiedebergs Arch Pharmacol. 2000. PMID: 10997721
-
Sodium excretion in response to vasopressin and selective vasopressin receptor antagonists.J Am Soc Nephrol. 2008 Sep;19(9):1721-31. doi: 10.1681/ASN.2008010021. Epub 2008 Jul 2. J Am Soc Nephrol. 2008. PMID: 18596120 Free PMC article.
-
Systemic and renal macro- and microcirculatory responses to arginine vasopressin in endotoxic rabbits.Crit Care Med. 2004 Sep;32(9):1891-8. doi: 10.1097/01.ccm.0000139708.10718.e3. Crit Care Med. 2004. PMID: 15343018
-
Nonpeptide antagonists for vasopressin receptors. Pharmacology of SR 121463A, a new potent and highly selective V2 receptor antagonist.Adv Exp Med Biol. 1998;449:427-38. Adv Exp Med Biol. 1998. PMID: 10026834 Review.
-
Septic acute kidney injury: the glomerular arterioles.Contrib Nephrol. 2011;174:98-107. doi: 10.1159/000329246. Epub 2011 Sep 9. Contrib Nephrol. 2011. PMID: 21921614 Review.
Cited by
-
Understanding urine output in critically ill patients.Ann Intensive Care. 2011 May 24;1(1):13. doi: 10.1186/2110-5820-1-13. Ann Intensive Care. 2011. PMID: 21906341 Free PMC article.
-
Epithelial transport during septic acute kidney injury.Nephrol Dial Transplant. 2014 Jul;29(7):1312-9. doi: 10.1093/ndt/gft503. Epub 2013 Dec 29. Nephrol Dial Transplant. 2014. PMID: 24378526 Free PMC article. Review.
-
Comparison of cardiac, hepatic, and renal effects of arginine vasopressin and noradrenaline during porcine fecal peritonitis: a randomized controlled trial.Crit Care. 2009;13(4):R113. doi: 10.1186/cc7959. Epub 2009 Jul 10. Crit Care. 2009. PMID: 19591694 Free PMC article.
-
Human Aquaporins: Functional Diversity and Potential Roles in Infectious and Non-infectious Diseases.Front Genet. 2021 Mar 16;12:654865. doi: 10.3389/fgene.2021.654865. eCollection 2021. Front Genet. 2021. PMID: 33796134 Free PMC article. Review.
-
Inhibition of inflammation using diacerein markedly improved renal function in endotoxemic acute kidney injured mice.Cell Mol Biol Lett. 2018 Aug 16;23:38. doi: 10.1186/s11658-018-0107-z. eCollection 2018. Cell Mol Biol Lett. 2018. Retraction in: Cell Mol Biol Lett. 2024 Jan 8;29(1):11. doi: 10.1186/s11658-023-00524-y. PMID: 30140293 Free PMC article. Retracted.
References
-
- DeMendonca A, Vincent JL, Suter PM, et al. Acute renal failure in the ICU: Risk factors and outcome evaluated by the SOFA score. Intensive Care Med. 2000;26:915–921. - PubMed
-
- Schrier RW, Wang W. Acute renal failure and sepsis. N Engl J Med. 2004;351:159–169. - PubMed
-
- Wan L, Bellomo R, Di Giantomasso D, et al. The pathogenesis of septic acute renal failure. Cur Opin Crit Care. 2003;9:496–502. - PubMed
Publication types
MeSH terms
Substances
Grants and funding
LinkOut - more resources
Full Text Sources
Molecular Biology Databases
Research Materials
Miscellaneous

