. 2008 Sep 30:8:164.
doi: 10.1186/1471-2180-8-164.

An efficient method for visualization and growth of fluorescent Xanthomonas oryzae pv. oryzae in planta

Affiliations

An efficient method for visualization and growth of fluorescent Xanthomonas oryzae pv. oryzae in planta

Sang-Wook Han et al. BMC Microbiol. .

Abstract

Background: Xanthomonas oryzae pv. oryzae, the causal agent of bacterial blight disease, is a serious pathogen of rice. Here we describe a fluorescent marker system to study virulence and pathogenicity of X. oryzae pv. oryzae.

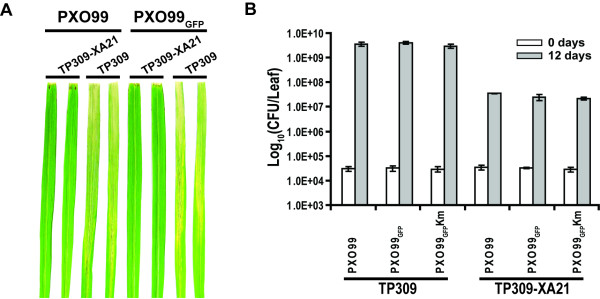
Results: A fluorescent X. oryzae pv. oryzae Philippine race 6 strain expressing green fluorescent protein (GFP) (PXO99GFP) was generated using the gfp gene under the control of the neomycin promoter in the vector, pPneo-gfp. The PXO99GFPstrain displayed identical virulence and avirulence properties as the wild type control strain, PXO99. Using fluorescent microscopy, bacterial multiplication and colonization were directly observed in rice xylem vessels. Accurate and rapid determination of bacterial growth was assessed using fluoremetry and an Enzyme-Linked ImmunoSorbant Assay (ELISA).

Conclusion: Our results indicate that the fluorescent marker system is useful for assessing bacterial infection and monitoring bacterial multiplication in planta.


Figures

Figure 1
Figure 1
Observation of Xanthomonas oryzae pv. oryzae carrying green fluorescence protein. PXO99GFP selected on PSA plates containing kanamycin (50 μg/ml) were cultured with 5 ml PS broth medium, harvested with centrifugation, washed with distilled water three times, re-suspended with 10 μl of autoclaved water, and then observed with microscope equipped with a fluorescein isothiocyanate filter (excitation filter, 450 to 490 nm; emission filter, 520 nm; dichroic mirror, 510 nm). Lefts are images with PXO99 wild type (up) and PXO99GFP (down) strains under bright light. Rights are the images of the bacteria with illumination of UV. The bars in the left bottom of each image indicate 5 μm.
Figure 2
Figure 2
Pathogenicity and virulence test for PXO99GFP in planta. A. Water-soaked disease lesions on two leaves from TP309 and TP309-XA21 at 12 days after PXO99 or PXO99GFP strains inoculation. B. After culture of PXO99 and PXO99GFP strains on PSA plates containing cephalexin, cells were diluted to 1.0 × 10⁸ CFU/ml, and then inoculated onto rice leaves of TP309 (susceptible) and TP309-XA21 (resistant) lines using the scissor clipping method. Bacteria were recovered from the leaves at 0 (white bar) and 12 (grey bar) DAI and serially diluted, and then spread on PSA plates containing either cephalexin or cephalexin/kanamycin for colony counting. Each bar represents averages ± standard deviation of three sampled leaves per treatment. The experiments were repeated three times with more than ten rice leaves from three individuals each time. Km, kanamycin.
Figure 3
Figure 3
Visualization of X. oryzae pv. oryzae expressing GFP in planta. TP309 (A and C) and TP309-XA21 (B and D) were inoculated with PXO99GFP, harvested at 12 DAI, and then visualized under Zeiss Axiophot fluorescence microscope (Jena, Germany). Transverse sections (A and B) and leaf surface (C and D) were observed with excitation from 450 to 490 nm and emitted light collected at 520 nm at × 40 (A and B) and × 10 (C and D) magnification. Bars in A and B, 50 μm. Bars in C and D, 10 μm.
Figure 4
Figure 4
Quantification of PXO99GFP expressing GFP using a fluoremeter or ELISA. A. Fluorescence of the bacteria recovered from the rice leaves was directly measured with a fluoremeter (excitation, 480 nm; emission, 520 nm). The bars indicate average of the fluorescence of each sample and the error bars are standard deviations from six technical replicates of two biological replicates. B. GFP protein expressed in PXO99GFP under host condition were quantified using ELISA, Inoculated bacterial strains, PXO99 (circle) and PXO99GFP (triangle), were recovered from the scored rice leaves of TP309 (close) and TP309-XA21 (open) at 0, 4, 8, and 12 DAI. ELISA using anti-GFP polyclonal IgG antibody then carried out. Each value represents averages of the absorbance at 480 nm and standard deviation from three leaves per treatment. Inset is the bacterial growth curve with linear scale. This experiment was repeated three times with more than ten rice leaves.

References

    1. Ou SH. Rice Diseases. Aberystwyth, England: Commonwealth Micrological Institute; 1985. pp. 70–74.
    1. Niño-Liu DO, Ronald PC, Bogdanove AJ. Xanthomonas oryzae pathovars: model pathogens of a model crop. Molecular Plant Pathology. 2006;7:303–324. - PubMed
    1. Mew TW. Xanthomonas oryzae pathovars on rice: cause of bacterial blight and bacteria leaf streak. London: Chapman & Hall; 1993.
    1. OEPP/EPPO Xanthomonas oryzae. EPPO Bulletin. 2007;37:543–553.
    1. Shimomura O, Johnson FH, Saiga Y. Extraction, purification and properties of aequorin, a bioluminescent protein from the luminous hydromedusan, Aequorea. J Cell Comp Physiol. 1962;59:223–239. - PubMed

Publication types

Substances