. 2008 Oct;14(10):1539-45.
doi: 10.3201/eid1410.071396.

Ecological factors associated with West Nile virus transmission, northeastern United States

Affiliations

Ecological factors associated with West Nile virus transmission, northeastern United States

Heidi E Brown et al. Emerg Infect Dis. 2008 Oct.

Abstract

Since 1999, West Nile virus (WNV) disease has affected the northeastern United States. To describe the spatial epidemiology and identify risk factors for disease incidence, we analyzed 8 years (1999-2006) of county-based human WNV disease surveillance data. Among the 56.6 million residents in 8 northeastern states sharing primary enzootic vectors, we found 977 cases. We controlled for population density and potential bias from surveillance and spatial proximity. Analyses demonstrated significant spatial spreading from 1999 through 2004 (p<0.01, r2 = 0.16). A significant trend was apparent among increasingly urban counties; county quartiles with the least (<38%) forest cover had 4.4-fold greater odds (95% confidence interval [CI] 1.4-13.2, p = 0.01) of having above-median disease incidence (>0.75 cases/100,000 residents) than counties with the most (>70%) forest cover. These results quantify urbanization as a risk factor for WNV disease incidence and are consistent with knowledge of vector species in this area.


Figures

Figure 1
Figure 1
Box plot of total incidence of West Nile virus disease in humans, by county, for the 8 northeastern states in the study area (CT, Connecticut; DE, Delaware; MA, Massachusetts; MD, Maryland; NJ, New Jersey; NY, New York; PA, Pennsylvania; RI, Rhode Island). The box plot provides the median, lower, and upper quartiles; the standard deviation; and any data outliers. This plot excludes those counties that did not report cases. The outliers tend to be the few cases that occurred in areas with low populations.
Figure 2
Figure 2
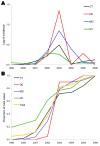
A) Epidemic curve of mean incidence (log+1 transformed) of West Nile virus disease in humans, by state, 1999–2006. The 4 states depicted are representative of the variation among the 8 states in the study area. CT, Connecticut; DE, Delaware; MD, Maryland; NY, New York. This graph shows the trend toward increasing incidence and a regional peak in 2003. NY seems to show a 2-year plateau with similar values for 2002 and 2003. B) Cumulative proportion of total cases for the 8 years also highlighting the 2003 regional peak but suggesting a spatial spread where cases started to rise earlier in NY than in states such as DE that were more distant from the epicenter.
Figure 3
Figure 3
Incidence of human West Nile virus disease cases in 8 northeastern states, 1999–2006. Deviation ellipses indicate 1 SD of the geographic mean yearly incidence calculated as the incidence weighted average in space for each county. Incidence is attributed to the county centroid. This graph shows the urban concentration along the Eastern Seaboard as well as the outliers in western Pennsylvania (1 case in counties with low populations). The 2005 and 2006 regression of the geographic mean incidence is also depicted.

References

    1. Petersen LR, Roehrig JT. West Nile virus: a reemerging global pathogen. Emerg Infect Dis. 2001;7:611–4. - PMC - PubMed
    1. Molaei G, Andreadis TG, Armstrong PM, Anderson JF, Vossbrinck CR. Host feeding patterns of Culex mosquitoes and West Nile virus transmission, northeastern United States. Emerg Infect Dis. 2006;12:468–74. - PMC - PubMed
    1. Marra PP, Griffing S, Caffrey C, Kilpatrick AM, McLean R, Brand C, et al. West Nile virus and wildlife. Bioscience. 2004;54:393–402. 10.1641/0006-3568(2004)054[0393:WNVAW]2.0.CO;2 - DOI
    1. Roberts RS, Foppa IM. Prediction of equine risk of West Nile Virus infection based on dead bird surveillance. Vector Borne Zoonotic Dis. 2006;6:1–6. 10.1089/vbz.2006.6.1 - DOI - PubMed
    1. Kilpatrick AM, Kramer LD, Jones MJ, Marra PP, Daszak P. West Nile virus epidemics in North America are driven by shifts in mosquito feeding behavior. PLoS Biol. 2006;4:606–10. 10.1371/journal.pbio.0040082 - DOI - PMC - PubMed

Publication types

LinkOut - more resources