

Bayesian coalescent inference of major human mitochondrial DNA haplogroup expansions in Africa
- PMID: 18826938
- PMCID: PMC2674340
- DOI: 10.1098/rspb.2008.0785
Bayesian coalescent inference of major human mitochondrial DNA haplogroup expansions in Africa
Abstract
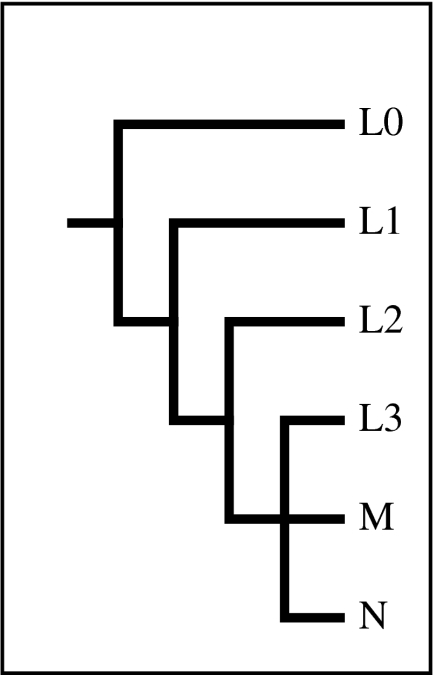
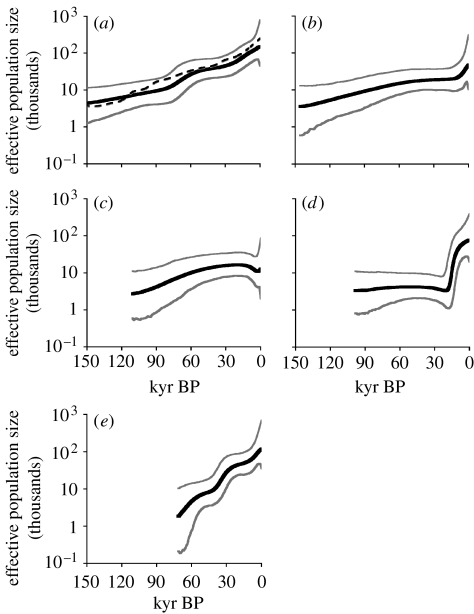
Past population size can be estimated from modern genetic diversity using coalescent theory. Estimates of ancestral human population dynamics in sub-Saharan Africa can tell us about the timing and nature of our first steps towards colonizing the globe. Here, we combine Bayesian coalescent inference with a dataset of 224 complete human mitochondrial DNA (mtDNA) sequences to estimate effective population size through time for each of the four major African mtDNA haplogroups (L0-L3). We find evidence of three distinct demographic histories underlying the four haplogroups. Haplogroups L0 and L1 both show slow, steady exponential growth from 156 to 213kyr ago. By contrast, haplogroups L2 and L3 show evidence of substantial growth beginning 12-20 and 61-86kyr ago, respectively. These later expansions may be associated with contemporaneous environmental and/or cultural changes. The timing of the L3 expansion--8-12kyr prior to the emergence of the first non-African mtDNA lineages--together with high L3 diversity in eastern Africa, strongly supports the proposal that the human exodus from Africa and subsequent colonization of the globe was prefaced by a major expansion within Africa, perhaps driven by some form of cultural innovation.
Figures
References
-
- Adams, J. M. & Faure, H. (eds) 1997 Review and atlas of palaeovegetation: preliminary land ecosystem maps of the world since the Last Glacial Maximum Oak Ridge, TN: Oak Ridge National Laboratory.
-
- Alonso S., Armour J.A. A highly variable segment of human subterminal 16p reveals a history of population growth for modern humans outside Africa. Proc. Natl Acad. Sci. USA. 2001;98:864–869. doi:10.1073/pnas.011244998 - DOI - PMC - PubMed
-
- Atkinson Q.D., Gray R.D., Drummond A.J. MtDNA variation predicts population size in humans and reveals a major southern Asian chapter in human prehistory. Mol. Biol. Evol. 2008;25:468–474. doi:10.1093/molbev/msm277 - DOI - PubMed
-
- Bandelt H.J., et al. Phylogeography of the human mitochondrial haplogroup L3e: a snapshot of African prehistory and Atlantic slave trade. Ann. Hum. Genet. 2001;65:549–563. doi:10.1046/j.1469-1809.2001.6560549.x - DOI - PubMed
Publication types
MeSH terms
Substances
LinkOut - more resources
Full Text Sources
Miscellaneous