. 2008 Oct 1;3(10):e3306.
doi: 10.1371/journal.pone.0003306.

Promoter DNA hypermethylation and gene repression in undifferentiated Arabidopsis cells

Affiliations

Promoter DNA hypermethylation and gene repression in undifferentiated Arabidopsis cells

María Berdasco et al. PLoS One. .

Abstract

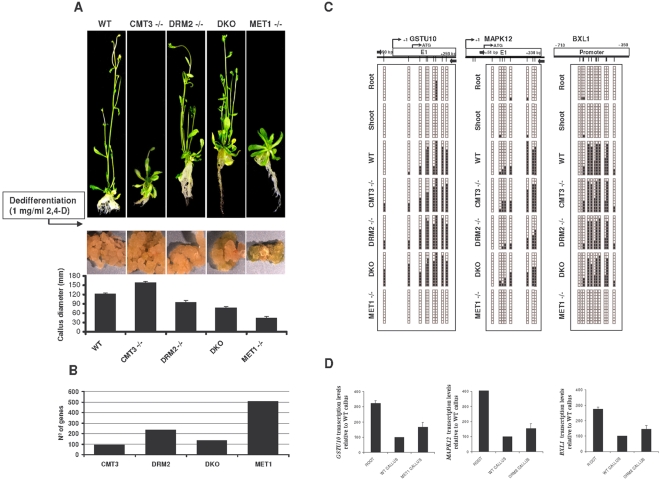
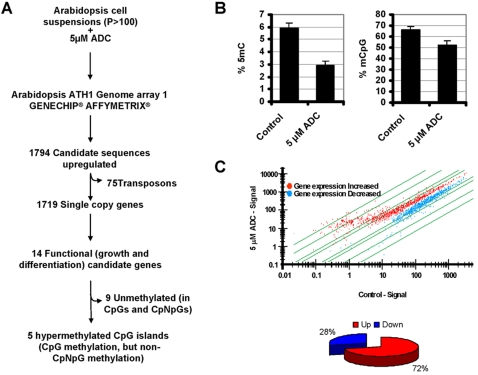
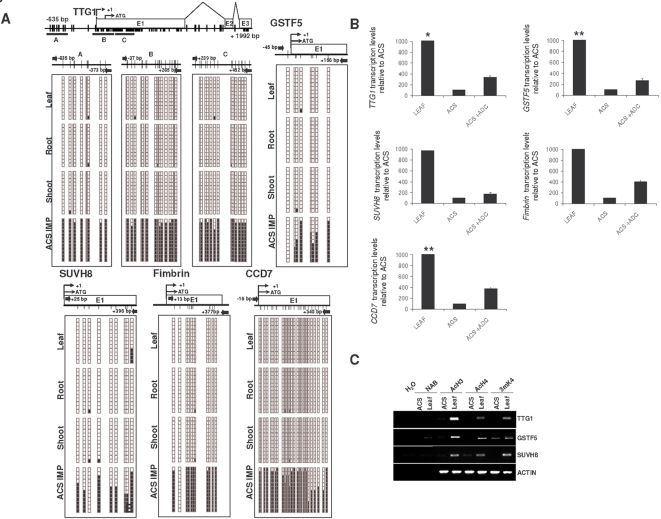
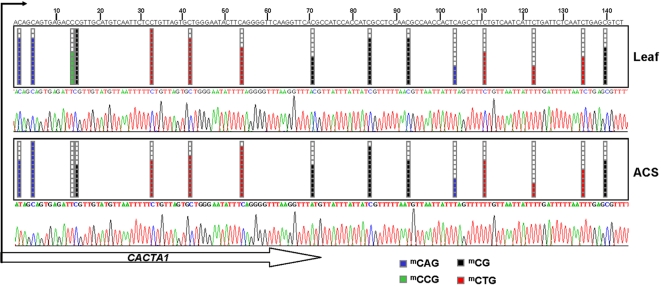
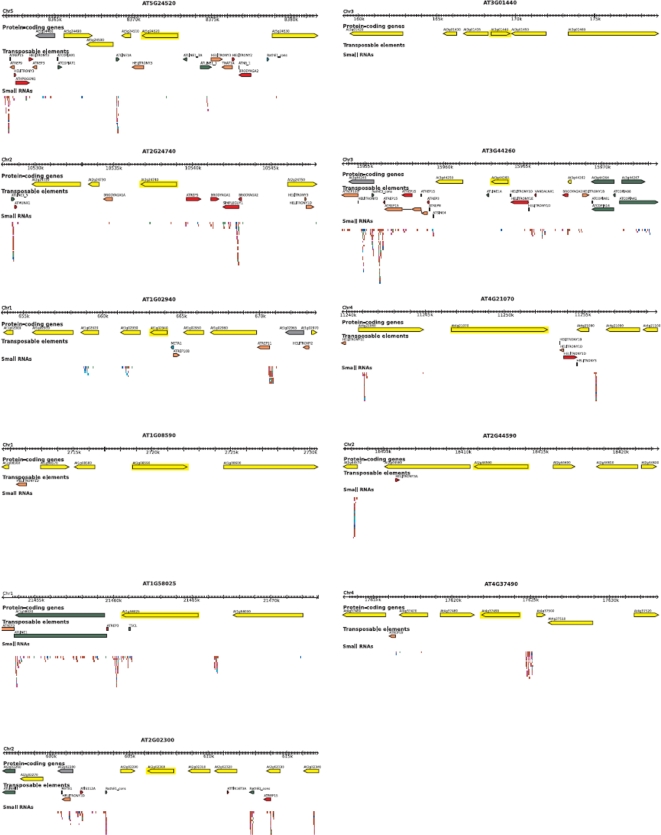
Maintaining and acquiring the pluripotent cell state in plants is critical to tissue regeneration and vegetative multiplication. Histone-based epigenetic mechanisms are important for regulating this undifferentiated state. Here we report the use of genetic and pharmacological experimental approaches to show that Arabidopsis cell suspensions and calluses specifically repress some genes as a result of promoter DNA hypermethylation. We found that promoters of the MAPK12, GSTU10 and BXL1 genes become hypermethylated in callus cells and that hypermethylation also affects the TTG1, GSTF5, SUVH8, fimbrin and CCD7 genes in cell suspensions. Promoter hypermethylation in undifferentiated cells was associated with histone hypoacetylation and primarily occurred at CpG sites. Accordingly, we found that the process specifically depends on MET1 and DRM2 methyltransferases, as demonstrated with DNA methyltransferase mutants. Our results suggest that promoter DNA methylation may be another important epigenetic mechanism for the establishment and/or maintenance of the undifferentiated state in plant cells.


Conflict of interest statement

Competing Interests: The authors have declared that no competing interests exist.

Figures

Figure 1
Figure 1. Promoter hypermethylation of Arabidopsis callus specifically depends on MET1 and DRM2 methyltransferase activity.
(A) Callus induction from DNA methyltransferases mutants. Upper panels, morphological aspect of entire plants grown from WT and DNA methyltransferase mutant seeds. Lower panels, growth rates of WT and mutant callus generated after treatment with 2,4-D of root explants. (B) Number of candidate genes susceptible to DNA methylation-dependent regulation obtained from each DNA methyltransferase mutant using the two-step criteria described in the Results section. (C) Bisulfite sequencing of twelve individual clones of the GSTU10, MAPK12 and BXL1 promoters in WT and DNA methyltransferase mutants. (D) Relationship between levels of GSTU10, MAPK12 and BXL1 expression and promoter DNA hypermethylation. Transcript levels of both genes were analyzed by quantitative RT-PCR and results are expressed as a relative enrichment of the hypomethylated samples (roots and methyltransferase mutants) versus the hypermethylated samples (WT callus).
Figure 2
Figure 2. Reactivation of hypermethylated genes in Arabidopsis cell suspensions (ACS) using demethylating drugs.
(A) Flowchart for identification of hypermethylated growth-associated genes. We used Arabidopsis cell suspensions after 5 µM ADC treatments followed by cRNA hybridization to a 22,500-oligonucleotide microarray. We obtained over 1,794 unique sequences overexpressed after treatments. Of these, 1,719 corresponded to known genes and 75 to repeat elements. We selected fourteen genes to test for promoter hypermethylation by direct bisulfite sequencing; five of them were found to be methylated in Arabidopsis cell suspensions but not in differentiated tissues such as roots and shoots. (B) Quantification of DNA methylation as: overall 5-methyl-cytosine (5 mC) using high-performance capillary electrophoresis (Left panel), and percentage of methylated CpGs using the methyl acceptor assay (Right panel). (C) Reactivation of genes in Arabidopsis cell suspensions after treatment with the demethylating drug ADC. Upper panel, scatterplots showing expression profiles of control cells and cells treated with ADC obtained by Affymetrix GeneChip technology; Lower panel, relative percentage of overexpressed and repressed genes after treatment with ADC.
Figure 3
Figure 3. Genomic DNA methylation status of reactivated genes in leaf and Arabidopsis cell suspensions (ACS).
(A) Bisulfite genomic sequencing of twelve clones of the TTG1 (three different regions), GSTF5, SUVH8, Fimbrin and CCD7 promoters. In the schematic representations of the methylation status of each CpG dinucleotides black and white dots indicate methylated and unmethylated CpGs, respectively. ACS IMP: Arabidopsis cell suspensions at intermediate passage. (B) Expression profiles of reactivated genes in leaves and Arabidopsis cell suspensions determined by quantitative RT-PCR assays. TTG1, GSTF5, SUVH8, Fimbrin and CCD7 are more strongly expressed in leaf tissues. Expression in cell suspensions can be restored by treatments with the demethylating drug ADC. ACTIN was used as a control. (*) the expression level of TTG1 in leafs is 80-fold higher than in ACS. (**) the expression level of GSTF5 and CCD7 in leafs is 40-fold higher than in ACS. (C) Promoter CpG island hypermethylation is associated with changes of histone modifications. Chromatin immunoprecipitation analysis of the histone-modification status of the promoters of the TTG1, GSTF5, and SUVH8 genes. NAB is the control without antibody. The promoter region of ACTIN is used as a control. AcH3, acetylated histone H3; AcH4, acetylated histone H4; 3mK4, trimethyl-lysine 3 histone H3.
Figure 4
Figure 4. Bisulfite genomic sequencing of twelve individual clones of the repeat DNA CACTA in leaves and Arabidopsis cell suspension (ACS).
Black and white dots indicate methylated and unmethylated CpGs, respectively. Methylation at CAG, CG, CCG, and CTG sites is represented by blue, black, green, and red boxes, respectively. The lower panels illustrate representative electropherograms.
Figure 5
Figure 5. Gbrowse view of gene, transposable element and small RNA annotation of 20 kb segments centered on the 2 CpG island containing genes selected with the genetic (GSTU10 and MAPK12) and pharmacologic (TTG1 and SUVH8) approaches.
Gene annotation is from TAIR (v7). TE annotation was performed using a novel detection pipeline (HQ, NB, and VC, manuscript in preparation). Small RNA data were directly imported from the ASRP database (http://asrp.cgrb.oregonstate.edu/cgi-bin/gbrowse/thaliana-v5) and corresponded to deep sequencing of small RNAs extracted from wild type plants (seedlings, leaves, and flowers).

References

    1. Grafi G. How cells dedifferentiate: a lesson from plants. Dev Biol. 2004;268:1–6. - PubMed
    1. Doerner P. Plant meristems: what you see is what you get? Curr Biol. 2006;16:R56–58. - PubMed
    1. Grafi G, Avivi Y. Stem cells: a lesson from dedifferentiation. Trends Biotechnol. 2004;22:388–389. - PubMed
    1. Costa S, Shaw P. ‘Open minded’ cells: how cells can change fate. Trends Cell Biol. 2007;17:101–106. - PubMed
    1. Lippman Z, Gendrel AV, Black M, Vaughn MW, Dedhia N, et al. Role of transposable elements in heterochromatin and epigenetic control. Nature. 2004;430:471–476. - PubMed

Publication types