Clinical Trial
. 2008 Oct;8(10):2086-96.
doi: 10.1111/j.1600-6143.2008.02377.x.

The effect of costimulatory and interleukin 2 receptor blockade on regulatory T cells in renal transplantation

Affiliations
Clinical Trial

The effect of costimulatory and interleukin 2 receptor blockade on regulatory T cells in renal transplantation

J A Bluestone et al. Am J Transplant. 2008 Oct.

Abstract

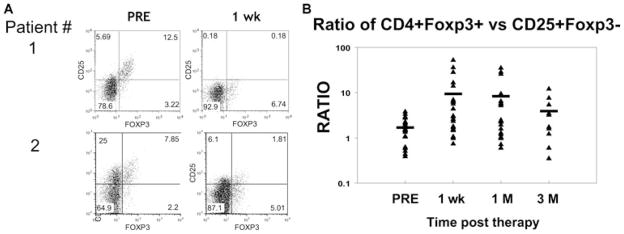
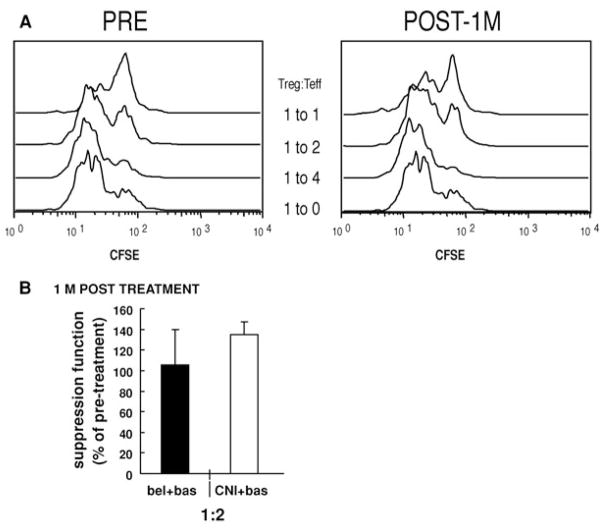
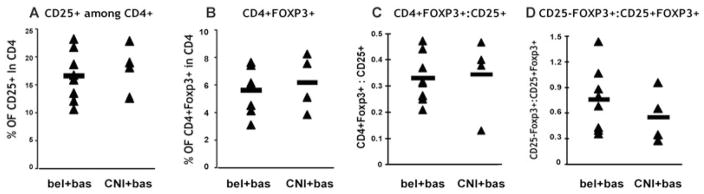
Regulatory T cells (Treg) are critical regulators of immune tolerance. Both IL-2 and CD28-CD80/CD86 signaling are critical for CD4(+)CD25(+)FOXP3(+) Treg survival in mice. Yet, both belatacept (a second-generation CTLA-4Ig) and basiliximab (an anti-CD25 monoclonal antibody) are among the arsenal of current immunotherapies being used in kidney transplant patients. In this study, we explored the direct effect of basiliximab and belatacept on the Tregs in peripheral blood both in the short term and long term and in kidney biopsies of patients with acute rejection. We report that the combined belatacept/basiliximab therapy has no long-term effect on circulating Tregs when compared to a calcineurin inhibitor (CNI)-treated group. Moreover, belatacept-treated patients had a significantly greater number of FOXP3(+) T cells in graft biopsies during acute rejection as compared to CNI-treated patients. Finally, it appears that the basiliximab caused a transient loss of both FOXP3(+) and FOXP3(-) CD25(+) T cells in the circulation in both treatment groups raising important questions about the use of this therapy in tolerance promoting therapeutic protocols.


Figures

Figure 1
Figure 1. Clinical trial protocol and dosing regimen
Patients were randomized to receive an intensive regimen of belatacept, a less-intensive regimen of belatacept, or cyclosporine for maintenance immunosuppression. Both belatacept regimens included an early phase (10 mg per kilogram of body weight), which was longer and more frequent in the intensive regimen, and a late phase (5 mg per kilogram of body weight at 4-week or 8-week intervals). All patients received induction therapy with basiliximab, mycophenolate mofetil and corticosteroid-taper.
Figure 2
Figure 2. Short-term effects of belatacept and basiliximab treatment of FOXP3+ Tregs
Human PBMCs were cell surface stained using a combination of anti-CD4, anti-CD25 and anti-CD127 mAbs. Once fixed, the cells were stained additionally with anti-FOXP3 mAb. (A) This panel represents the changes of FOXP3+ Tregs in the whole cohort of patients before treatment and at different time points posttreatment in either the Belatacept or CNI arms. The cells are gated on CD4+ and percentage of CD25+ cells were analyzed. Data are representative of 10–22 independent individuals from either Belatacept group or CNI group, shown as Mean ± SD with both competing (black bar) and noncompeting (grey bar) anti-CD25 mAbs. (B) This panel represents the ratio of CD25-FOXP3+ versus CD25+FOXP3+ with competing anti-CD25 mAb. Each solid black triangle represents an independent individual, the solid bar represents average percentage among the 10–22 individuals. (C) This panel represents the quantitative changes in CD4+FoxP3+ cells before treatment and at different time points posttreatment in both the belatacept group and CNI groups. Each solid black diamond represents an individual, the solid bar represents the average percentage among the individuals examined. (D) This panel represents the percentage of CD4+CD127 lo/− cells in the whole cohort of patients before treatment and at different time points posttreatment. Each solid black diamond represents an independent individual, the solid bar represents the average percentage among the individuals from both belatacept and CNI groups.
Figure 3
Figure 3. Anti-CD25 therapy results in a selective loss of CD25+ non-Tregs in the short term
For analysis, the PBMCs were gated on lymphocytes (based on forward and side light scatter) and CD4+ cells and analyzed for CD25 and FOXP3 expression. (A) This panel represents two individual patients comparing CD25+ Treg versus CD25+ non-Tregs. The numbers in the dot plot indicate the percentage of gated cells expressing the relevant marker. (B) This panel represents the ratio of CD4+FOXP3+ versus CD25+FOXP3- cells. Data are representative of 10–22 independent individuals (pooled from both the Belatacept plus Basiliximab and CsA plus Basiliximab groups) at different time point pre- and post-treatment.
Figure 4
Figure 4. Suppressive activity of CD4+CD127lo/− cells on a per cell basis
PBMCs were isolated using Ficoll-plaque from human peripheral blood and stained with anti-CD4 and anti-CD127. CD4+CD127 lo/− were sorted using FACSAria and cultured with CFSE-labeled responder cells (PBMC from an unrelated individual) at different Tregs:Tconv ratios, along with anti-CD3/anti-CD28. Cultured cells were analyzed by gating on CD8+ cells using FACSCalibur and cell division determined using the Modfit software program. (A) Suppression in the original CFSE histograms from one representative patient is illustrated. Data are shown as Treg:Tconv at 1:1 ratio and 1:2 ratios. (B) This panel represents the suppressive function of Tregs in the whole cohort of patients before treatment and at 1 month posttreatment in either the belatacept or CNI arms. Percentage of suppression was normalized to the pretreatment level of each individual (percentage of pretreatment = percentage of suppression of posttreatment/percentage of suppression of pre-treatment × 100). Data were shown as Treg:Tconv at a 1:2 ratio. Black bars represent six individuals of belatacept group, Mean ± SD. Grey bars represent four individuals of CNI group, Mean ± SD.
Figure 5
Figure 5. No long-term effect of belatacept or CNI treatment on FOXP3+ Treg numbers
PBMCs were isolated and stained with CD4, CD25 and CD127. Once fixed and permeablized, the cells were stained with anti-FOXP3 mAb. PBMCs were gated on lymphocytes and CD4+ before CD25 and FOXP3 analysis. (A) This panel represents the percentage of CD25+ in the CD4 gate for each individual. (B) This panel represents the percentage of CD4+FOXP3+ cells. (C) This panel shows the ratio of CD4+FOXP3+ versus CD25+ cells for each individual. (D) This panel shows the ratio of CD25FOXP3+ versus CD25+FOXP3+ cells. Each solid black triangle represents an independent individual, the solid bar represents an average number of 4–8 individuals.
Figure 6
Figure 6. Suppressive activity of CD4+CD127lo/− and CD4+CD25+CD127lo/− cells on a per cell basis
PBMCs were isolated, stained and sorted for CD4+CD127lo/− and/or CD4+CD25+CD127 lo/− cells. The CFSE dilution assay was used to test suppression function. Percentage of suppression was normalized by the healthy control performed at the same time (normalization formula: percentage of healthy control = percentage of suppression of patient/percentage of suppression of healthy control × 100). Data were shown as Treg versus Tconv at 1:1 and 1:2 ratios. Each solid black triangle represents an independent individual, the solid bar represents an average number of 2–8 individuals.
Figure 7
Figure 7. CD86 receptor competition assay
(A) This panel depicts the median fluorescence intensity of CD86 expression on monocytes from three treated patients (tested twice). This analysis utilized the noncompeting anti-CD86 mAb, 2D4. (B) In this panel, the ratio of the competing HA5 to2D4 staining is depicted for the same three individuals at two time points showing that a significant percentage of free CD86 was evident at time of trough levels of belatacept therapy.
Figure 8
Figure 8. IHC of biopsies from patients undergoing acute rejection
Representative microphotographs from the biopsies of calcineurin-inhibitor (A) and belatacept (B and C)-treated patients. Double immunohistochemical stains for CD3 (blue) and FOXP3 (brown) demonstrate a higher number of FOXP3-positive cells in the interstitial cellular infiltrates in the biopsy from the belatacept-treated patient. Note that FOXP3-positive cells are present not only in the interstitial areas, but also between the tubular epithelial cells in a tubule showing prominent tubulitis (C). Magnifications: A and B = 40×; C = 100×.
Figure 9
Figure 9. Ratio of FOXP3+ to CD3+ cells in biopsies
The FOXP3/CD3 ratio is depicted as a mean and standard deviation for the group of individuals in each treatment group. A significantly higher percentage of Fopxp3+ T cells were observed in the belatacept biopsies (p< 0.05).

References

    1. Sakaguchi S, Sakaguchi N, Shimizu J, et al. Immunologic tolerance maintained by CD25+ CD4+ regulatory T cells: Their common role in controlling autoimmunity, tumor immunity, and transplantation tolerance. Immunol Rev. 2001;182:18–32. - PubMed
    1. Yamamoto AM, Chernajovsky Y, Lepault F, et al. The activity of immunoregulatory T cells mediating active tolerance is potentiated in nonobese diabetic mice by an IL-4-based retroviral gene therapy. J Immunol. 2001;166:4973–4980. - PubMed
    1. Wood KJ, Sakaguchi S. Regulatory T cells in transplantation tolerance. Nat Rev Immunol. 2003;3:199–210. - PubMed
    1. Singh B, Read S, Asseman C, et al. Control of intestinal inflammation by regulatory T cells. Immunol Rev. 2001;182:190–200. - PubMed
    1. Curotto de Lafaille MA, Lafaille JJ. CD4(+) regulatory T cells in autoimmunity and allergy. Curr Opin Immunol. 2002;14:771–778. - PubMed

Publication types

MeSH terms