

Haplotypic variants in DRD2, ANKK1, TTC12, and NCAM1 are associated with comorbid alcohol and drug dependence
- PMID: 18828801
- PMCID: PMC2975565
- DOI: 10.1111/j.1530-0277.2008.00800.x
Haplotypic variants in DRD2, ANKK1, TTC12, and NCAM1 are associated with comorbid alcohol and drug dependence
Abstract
Background: Each gene in the chromosome 11q23 cluster of NCAM1, TTC12, ANKK1, and DRD2 is functionally linked to dopamine in brain. Many association studies of DRD2 and substance dependence (SD), including alcohol dependence (AD) and drug dependence (DD), have been reported; the results have been inconsistent. Recent association studies have considered this cluster more comprehensively, examining the association of SD with several risk variants mapped to the other genes in the cluster. Because comorbid AD with DD (AD+DD) is common, we hypothesized that heterogeneity of the SD diagnoses studied might have contributed to the inconsistency of prior results.
Methods: We conducted 2 separate association studies of AD+DD and AD without DD (AD-only) in 1,090 European-Americans using family-based and case-control designs and 43 single nucleotide polymorphisms mapped to this cluster. We used a generalized linear model and haplotype score tests for the case-control sample, and the family-based association test for the family sample.
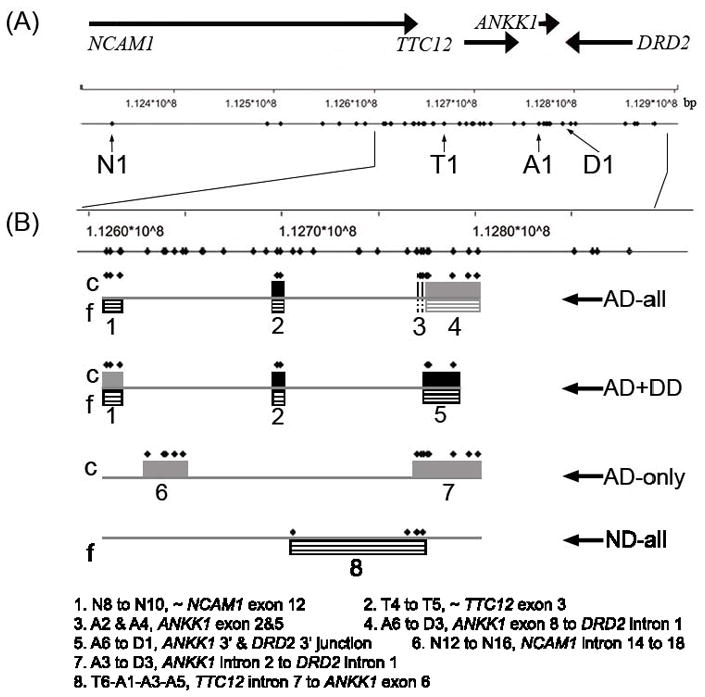
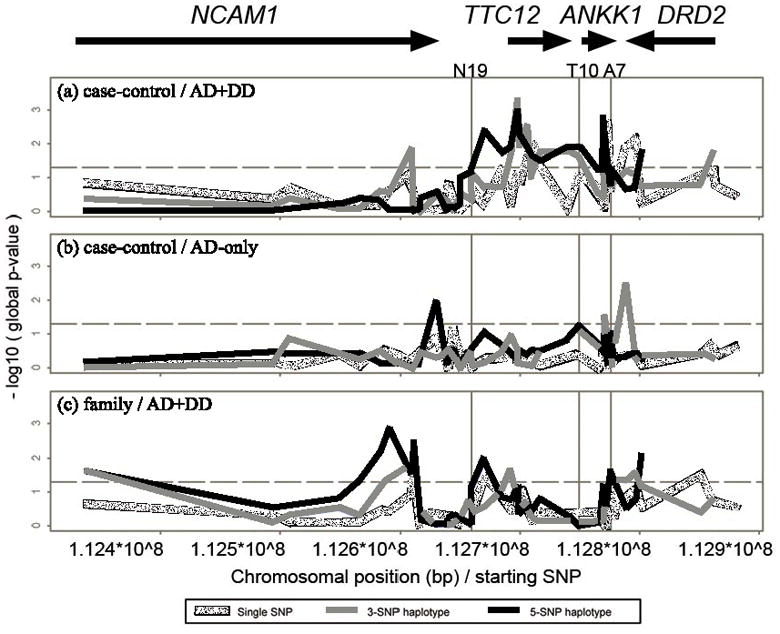
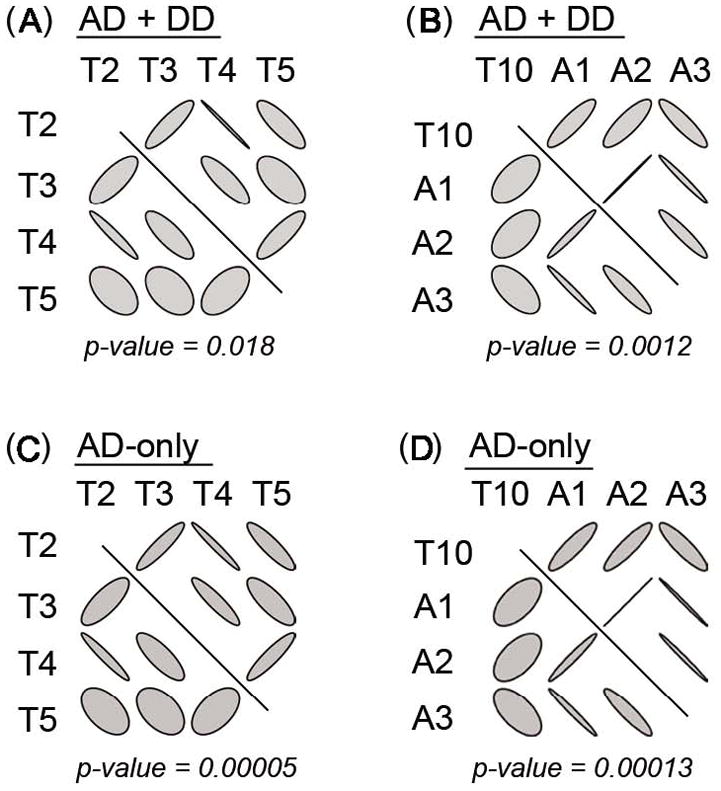
Results: For AD+DD, the risk regions centered on TTC12 exon 3 [optimal individual haplotype simulated p (p(oihs)) = 0.000015], and another extended from ANKK1 exon 8 to DRD2;C957T (p(oihs) = 0.0028), in both samples. NCAM1 exon 12 markers showed global significance in both designs, but were significant for specific haplotypes (p(oihs) = 0.0029) only for the family sample. For AD-only, NCAM1 intron 14 to 18 and the junction of ANKK1 and DRD2 were associated globally. Population stratification was excluded as the basis for these results. Linkage disequilibrium contrast tests supported selection at TTC12 exon 3 and ANKK1 exon 2.
Conclusions: We conclude that variants in TTC12 exon 3, NCAM1 exon 12, and the two 3'-ends of ANKK1 and DRD2 co-regulate risk for comorbid AD and DD.
Figures
References
-
- Agrawal A, Edenberg HJ, Foroud T, Bierut LJ, Dunne G, Hinrichs AL, Nurnberger JI, Crowe R, Kuperman S, Schuckit MA, Begleiter H, Porjesz B, Dick DM. Association of GABRA2 with drug dependence in the collaborative study of the genetics of alcoholism sample. Behav Genet. 2006;36(5):640–50. - PubMed
-
- Barrett JC, Fry B, Maller J, Daly MJ. Haploview: analysis and visualization of LD and haplotype maps. Bioinformatics. 2005;21(2):263–5. - PubMed
-
- Baum AE, Akula N, Cabanero M, Cardona I, Corona W, Klemens B, Schulze TG, Cichon S, Rietschel M, Nothen MM, Georgi A, Schumacher J, Schwarz M, Abou Jamra R, Hofels S, Propping P, Satagopan J, Detera-Wadleigh SD, Hardy J, McMahon FJ. A genome-wide association study implicates diacylglycerol kinase eta (DGKH) and several other genes in the etiology of bipolar disorder. Mol Psychiatry 2007 - PMC - PubMed
-
- Castelo-Branco G, Arenas E. Function of Wnts in dopaminergic neuron development. Neurodegener Dis. 2006;3(1–2):5–11. - PubMed
-
- Castelo-Branco G, Rawal N, Arenas E. GSK-3beta inhibition/beta-catenin stabilization in ventral midbrain precursors increases differentiation into dopamine neurons. J Cell Sci. 2004;117(Pt 24):5731–7. - PubMed
Publication types
MeSH terms
Substances
Grants and funding
- K24 DA15105/DA/NIDA NIH HHS/United States
- R01 DA012849/DA/NIDA NIH HHS/United States
- K24 DA015105/DA/NIDA NIH HHS/United States
- K08 AA013732/AA/NIAAA NIH HHS/United States
- K24 AA13736/AA/NIAAA NIH HHS/United States
- R01 AA011330/AA/NIAAA NIH HHS/United States
- P60 AA003510/AA/NIAAA NIH HHS/United States
- R01 DA12690/DA/NIDA NIH HHS/United States
- R01 AA016015/AA/NIAAA NIH HHS/United States
- P50 AA003510/AA/NIAAA NIH HHS/United States
- R01 DA012690/DA/NIDA NIH HHS/United States
- R01 AA11330/AA/NIAAA NIH HHS/United States
- K08 AA13732/AA/NIAAA NIH HHS/United States
- R01 DA12849/DA/NIDA NIH HHS/United States
- M01 RR06192/RR/NCRR NIH HHS/United States
- K24 AA013736/AA/NIAAA NIH HHS/United States
- M01 RR006192/RR/NCRR NIH HHS/United States
- P50 AA12870/AA/NIAAA NIH HHS/United States
- P50 AA012870/AA/NIAAA NIH HHS/United States
LinkOut - more resources
Full Text Sources
Medical
Molecular Biology Databases
Research Materials
Miscellaneous
