High-density SNP genotyping to define beta-globin locus haplotypes
- PMID: 18829352
- PMCID: PMC4251776
- DOI: 10.1016/j.bcmd.2008.07.002
High-density SNP genotyping to define beta-globin locus haplotypes
Abstract
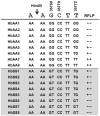
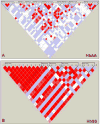
Five major beta-globin locus haplotypes have been established in individuals with sickle cell disease (SCD) from the Benin, Bantu, Senegal, Cameroon, and Arab-Indian populations. Historically, beta-haplotypes were established using restriction fragment length polymorphism (RFLP) analysis across the beta-locus, which consists of five functional beta-like globin genes located on chromosome 11. Previous attempts to correlate these haplotypes as robust predictors of clinical phenotypes observed in SCD have not been successful. We speculate that the coverage and distribution of the RFLP sites located proximal to or within the globin genes are not sufficiently dense to accurately reflect the complexity of this region. To test our hypothesis, we performed RFLP analysis and high-density single nucleotide polymorphism (SNP) genotyping across the beta-locus using DNA samples from healthy African Americans with either normal hemoglobin A (HbAA) or individuals with homozygous SS (HbSS) disease. Using the genotyping data from 88 SNPs and Haploview analysis, we generated a greater number of haplotypes than that observed with RFLP analysis alone. Furthermore, a unique pattern of long-range linkage disequilibrium between the locus control region and the beta-like globin genes was observed in the HbSS group. Interestingly, we observed multiple SNPs within the HindIII restriction site located in the Ggamma-globin intervening sequence II which produced the same RFLP pattern. These findings illustrated the inability of RFLP analysis to decipher the complexity of sequence variations that impacts genomic structure in this region. Our data suggest that high-density SNP mapping may be required to accurately define beta-haplotypes that correlate with the different clinical phenotypes observed in SCD.
Figures


Similar articles
-
Atypical beta(s) haplotypes are generated by diverse genetic mechanisms.Am J Hematol. 2000 Feb;63(2):79-84. doi: 10.1002/(sici)1096-8652(200002)63:2<79::aid-ajh4>3.0.co;2-d. Am J Hematol. 2000. PMID: 10629573
-
Acute chest syndrome is associated with single nucleotide polymorphism-defined beta globin cluster haplotype in children with sickle cell anaemia.Br J Haematol. 2013 Oct;163(2):268-76. doi: 10.1111/bjh.12507. Epub 2013 Aug 16. Br J Haematol. 2013. PMID: 23952145 Free PMC article.
-
βS globin gene haplotype and the stroke risk among Egyptian children with sickle cell disease.Hematology. 2018 Jul;23(6):362-367. doi: 10.1080/10245332.2017.1403736. Epub 2017 Nov 20. Hematology. 2018. PMID: 29157167
-
Sickle cell disease in Middle East Arab countries.Indian J Med Res. 2011 Nov;134(5):597-610. doi: 10.4103/0971-5916.90984. Indian J Med Res. 2011. PMID: 22199098 Free PMC article. Review.
-
The Genetic and Clinical Significance of Fetal Hemoglobin Expression in Sickle Cell Disease.Med Princ Pract. 2021;30(3):201-211. doi: 10.1159/000511342. Epub 2020 Sep 4. Med Princ Pract. 2021. PMID: 32892201 Free PMC article. Review.
Cited by
-
Evolutionary constraints in the β-globin cluster: the signature of purifying selection at the δ-globin (HBD) locus and its role in developmental gene regulation.Genome Biol Evol. 2013;5(3):559-71. doi: 10.1093/gbe/evt029. Genome Biol Evol. 2013. PMID: 23431002 Free PMC article.
-
Refinement of evolutionary medicine predictions based on clinical evidence for the manifestations of Mendelian diseases.Sci Rep. 2019 Dec 9;9(1):18577. doi: 10.1038/s41598-019-54976-4. Sci Rep. 2019. PMID: 31819097 Free PMC article.
-
Frequency and origin of haplotypes associated with the beta-globin gene cluster in individuals with trait and sickle cell anemia in the Atlantic and Pacific coastal regions of Colombia.Genet Mol Biol. 2013 Dec;36(4):494-7. doi: 10.1590/S1415-47572013000400005. Epub 2013 Nov 8. Genet Mol Biol. 2013. PMID: 24385850 Free PMC article.
-
Beta-globin gene haplotypes among cameroonians and review of the global distribution: is there a case for a single sickle mutation origin in Africa?OMICS. 2015 Mar;19(3):171-9. doi: 10.1089/omi.2014.0134. OMICS. 2015. PMID: 25748438 Free PMC article.
-
Haplotype Analysis of β-Thalassaemia Major and Carriers with Filipino β°-Deletion in Sabah, Malaysia.Malays J Med Sci. 2018 Jul;25(4):63-71. doi: 10.21315/mjms2018.25.4.6. Epub 2018 Aug 30. Malays J Med Sci. 2018. PMID: 30914848 Free PMC article.
References
-
- Wainscoat JS, Hill AV, Boyce AL, et al. Evolutionary relationships of human populations from an analysis of nuclear DNA polymorphisms. Nature. 1986;319:491–3. - PubMed
-
- Kan YW, Lee KY, Furbetta M, et al. Polymorphism of DNA sequence in the beta-globin gene region. Application to prenatal diagnosis of beta 0 thalassemia in Sardinia. N Engl J Med. 1980;302:185–8. - PubMed
-
- Oner C, Dimovski AJ, Altay C, et al. Sequence variations in the 5′ hypersensitive site-2 of the locus control region of beta S chromosomes are associated with different levels of fetal globin in hemoglobin S homozygotes. Blood. 1992;79:813–9. - PubMed
-
- Nagel RL, Fleming AF. Genetic epidemiology of the beta s gene. Baillieres Clin Haematol. 1992;5:331–65. - PubMed
Publication types
MeSH terms
Substances
Grants and funding
LinkOut - more resources
Full Text Sources
Medical

