. 2008 Oct 7;105(40):15281-6.
doi: 10.1073/pnas.0804678105. Epub 2008 Sep 30.

Quantitative proteomic analysis of primary neurons reveals diverse changes in synaptic protein content in fmr1 knockout mice

Affiliations

Quantitative proteomic analysis of primary neurons reveals diverse changes in synaptic protein content in fmr1 knockout mice

Lujian Liao et al. Proc Natl Acad Sci U S A. .

Abstract

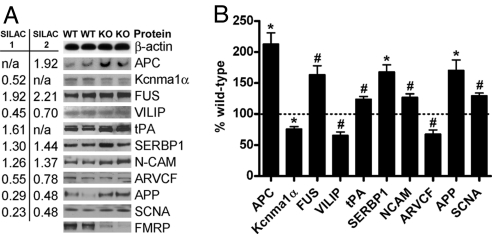
Fragile X syndrome (FXS) is a common inherited form of mental retardation that is caused, in the vast majority of cases, by the transcriptional silencing of a single gene, fmr1. The encoded protein, FMRP, regulates mRNA translation in neuronal dendrites, and it is thought that changes in translation-dependent forms of synaptic plasticity lead to many symptoms of FXS. However, little is known about the potentially extensive changes in synaptic protein content that accompany loss of FMRP. Here, we describe the development of a high-throughput quantitative proteomic method to identify differences in synaptic protein expression between wild-type and fmr1-/- mouse cortical neurons. The method is based on stable isotope labeling by amino acids in cell culture (SILAC), which has been used to characterize differentially expressed proteins in dividing cells, but not in terminally differentiated cells because of reduced labeling efficiency. To address the issue of incomplete labeling, we developed a mathematical method to normalize protein ratios relative to a reference based on the labeling efficiency. Using this approach, in conjunction with multidimensional protein identification technology (MudPIT), we identified >100 proteins that are up- or down-regulated. These proteins fall into a variety of functional categories, including those regulating synaptic structure, neurotransmission, dendritic mRNA transport, and several proteins implicated in epilepsy and autism, two endophenotypes of FXS. These studies provide insights into the potential origins of synaptic abnormalities in FXS and a demonstration of a methodology that can be used to explore neuronal protein changes in neurological disorders.


Conflict of interest statement

The authors declare no conflict of interest.

Figures

Fig. 1.
Fig. 1.
Schematic overview of quantitative proteomics using stable isotope labeling of primary neurons. (A) WT neurons were cultured in heavy arginine- and lysine-enriched medium for the desired number of days and subject to MudPIT analysis. The resulting ratio (R1) was the labeling ratio. (B) Same as A, except that after obtaining the synaptosomal preparation, a 1:1 ratio of labeled wild type and unlabeled KO synaptosomes were mixed before trypsin digestion. (C) Theoretical spectra used to derive the normalization equation.
Fig. 2.
Fig. 2.
Evaluation of isotope incorporation in cultured cortical neurons. (A and B) Heavy isotope enrichment ratios at DIV18 at peptide and protein level, respectively. (C) Relative labeling efficiencies of proteins in 10 distinct cell component categories at DIV18 (efficiency: low, <85%; mid, 85–90%; high, >90%). For each category, the y axis represents the relative percentage of proteins in each of the three labeling efficiencies. ER, endoplasmic reticulum. Three independent labeling experiments were performed to allow statistical testing. * and ** indicate significant differences between labeling efficiency categories (Student's t test, P < 0.05). (D) Labeling time course of nine cell component categories. Proteins at different categories showed different enrichment rates, but majority of them reached similar labeling efficiency at day 21.
Fig. 3.
Fig. 3.
The normalization equation corrected a skewed distribution. (A and B) Peptide and protein ratios between WT labeled and WT unlabeled samples before the correction show a skewed distribution from Gaussian. (C and D) After applying the equation, both peptide and protein ratio distribution were well fitted to Gaussian distribution.
Fig. 4.
Fig. 4.
The SILAC approach applied to analyze differential protein expression in fmr1 KO mice. (A and B) Scattered plots of peptide and protein ratios in two MudPIT runs show reasonable correlation and therefore reproducibility. (C and D) Histogram of two independent SILAC experiments showing that the precision and accuracy depend on protein/peptide labeling ratio. Better enrichment ratio translates to higher accuracy and precision. (The label “Enrich” refers to protein enrichment ratio, which is expressed as an average value of all of the peptides that identify the corresponding protein.) (E) Coverage of the normalization equation is demonstrated using a Venn diagram. The overlapped proteins between the two MudPIT runs of the labeled and the 1:1 mixture are those that can be normalized.
Fig. 5.
Fig. 5.
Western blot validation of proteins identified as significantly changed. (A) Synaptosomes from postnatal day 14 mice cortices were analyzed by Western blot using 11 antibodies against the proteins listed on the right of the blots, with FMRP shown to indicate the genotype. The corresponding expression ratios from two SILAC experiments were listed on the left. (B) Quantification of the Western blot intensity. APC, adenomatous polypopsis coli; Kcnma1α, Ca++-activated potassium channel alpha subunit 1; FUS, RNA-binding protein FUS; VILIP, Visinin-like protein 1; tPA, tissue plasminogen activator; SERBP1, PAI-1 RNA-binding protein 1; N-CAM, neuronal cell adhesion molecule (N-CAM 180); ARVCF, armadillo repeat deleted in velocardiofacial syndrome; APP, amyloid precursor protein; SCNA, α-synuclein. (Student's t test, n = 5, *, P < 0.01; #, P < 0.04).

References

    1. de la Cruz FF. Fragile X syndrome. Am J Ment Defic. 1985;90:119–123. - PubMed
    1. Hagerman RJ. Fragile X-associated tremor/ataxia syndrome–an older face of the fragile X gene. J Dev Behav Pediatr. 2006;27:63–74. - PubMed
    1. Di Bonaventura C, et al. Status epilepticus in a patient with fragile X syndrome: Electro-clinical features and peri-ictal neuroimaging. Epileptic Disord. 2006;8:195–199. - PubMed
    1. Irwin SA, Galvez R, Greenough WT. Dendritic spine structural anomalies in fragile-X mental retardation syndrome. Cereb Cortex. 2000;10:1038–1044. - PubMed
    1. Grossman AW, Aldridge GM, Weiler IJ, Greenough WT. Local protein synthesis and spine morphogenesis: Fragile X syndrome and beyond. J Neurosci. 2006;26:7151–7155. - PMC - PubMed

Publication types

LinkOut - more resources