. 2008 Dec 12;283(50):35236-46.
doi: 10.1074/jbc.M805634200. Epub 2008 Sep 30.

Specificity of interactions between mDia isoforms and Rho proteins

Affiliations

Specificity of interactions between mDia isoforms and Rho proteins

Michael Lammers et al. J Biol Chem. .

Abstract

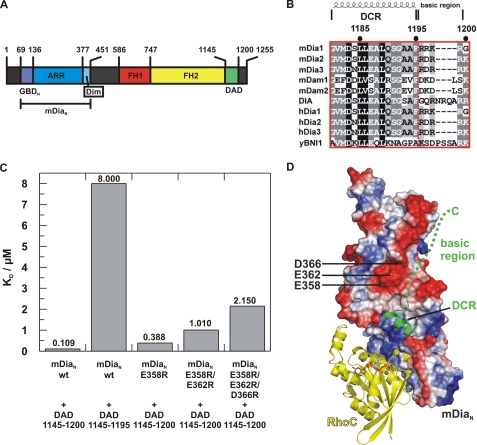
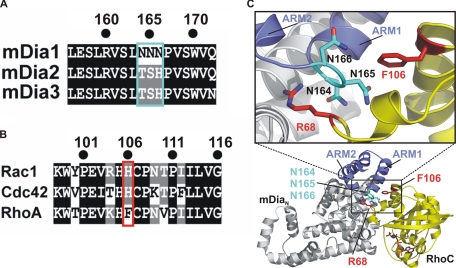
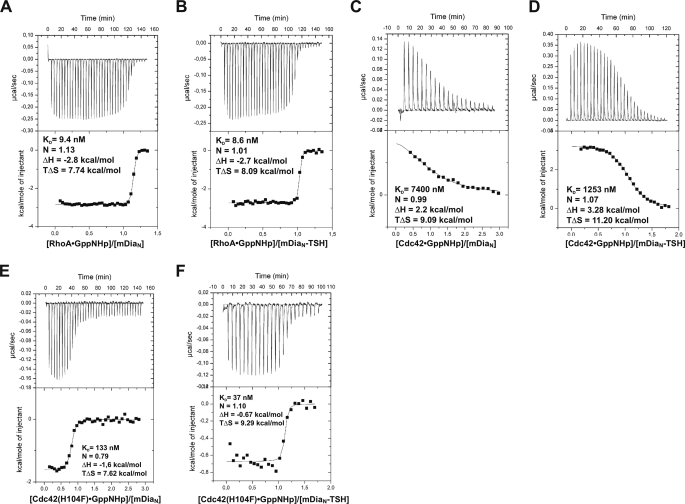
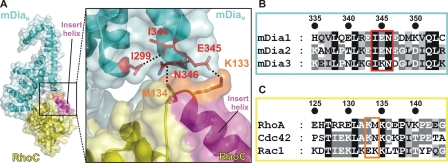
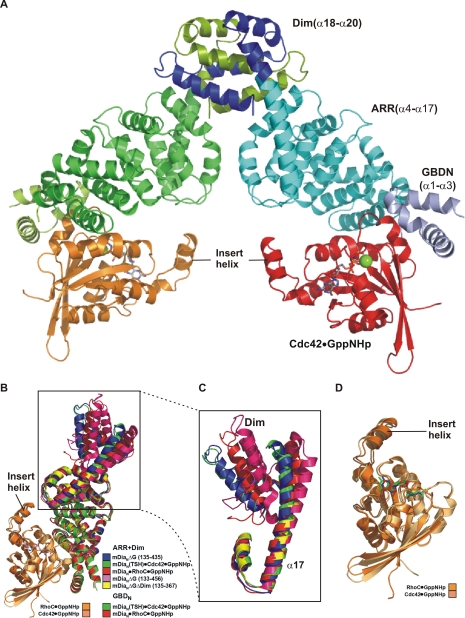
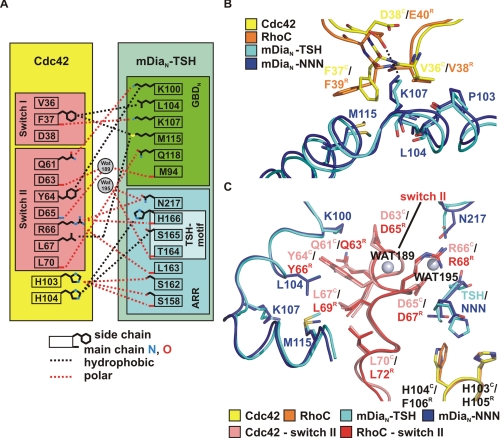
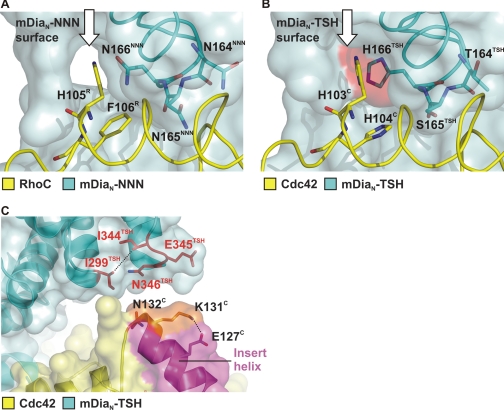
Formins are key regulators of actin nucleation and polymerization. They contain formin homology 1 (FH1) and 2 (FH2) domains as the catalytic machinery for the formation of linear actin cables. A subclass of formins constitutes the Diaphanous-related formins, members of which are regulated by the binding of a small GTP-binding protein of the Rho subfamily. Binding of these molecular switch proteins to the regulatory N-terminal mDia(N), including the GTPase-binding domain, leads to the release of auto-inhibition. From the three mDia isoforms, mDia1 is activated only by Rho (RhoA, -B, and -C), in contrast to mDia2 and -3, which is also activated by Rac and Cdc42. Little is known about the determinants of specificity. Here we report on the interactions of RhoA, Rac1, and Cdc42 with mDia1 and an mDia1 mutant (mDia(N)-Thr-Ser-His (TSH)), which based on structural information should mimic mDia2 and -3. Specificity is analyzed by biochemical studies and a structural analysis of a complex between Cdc42.Gpp(NH)p and mDia(N)-TSH. A triple NNN motif in mDia1 (amino acids 164-166), corresponding to the TSH motif in mDia2/3 (amino acids 183-185 and 190-192), and the epitope interacting with the Rho insert helix are essential for high affinity binding. The triple N motif of mDia1 allows tight interaction with Rho because of the presence of Phe-106, whereas the corresponding His-104 in Rac and Cdc42 forms a complementary interface with the TSH motif in mDia2/3. We also show that the F106H and H104F mutations drastically alter the affinities and thermodynamics of mDia interactions.


Figures

FIGURE 1.
FIGURE 1.
Localization of the DAD on mDia. A, schematic representation of the domain organization of mDia1, with GBDN, GTPase-binding domain; ARR, Armadillo-repeat region; Dim, dimerization domain; FH1-2, Formin homology domains 1-2; DAD, Diaphanous autoregulatory domain; mDiaN, the N-terminal regulatory region. B, sequence alignment of DAD-core region (DCR) and basic region from different genes and organisms (SwissProt accession numbers in parentheses): mDia1-3, mouse (O08808, Q9Z207, and O70566); mDam1-2, mouse (Q8BPM0 and Q80U19); Dia, Drosophila (P48608); hDia1-3, human (O60610, O60879, and Q9NSV4); yBNI1, S. cerevisiae (P41832). 100% conserved, black-shaded; 80% conserved, dark gray; 60% conserved, light gray. C, equilibrium dissociation constants (KD) (from ITC) for WT and mutant DAD constructs as indicated. D, model of the ternary mDiaN·RhoC·DAD complex obtained by superimposition of the mDiaN·DAD complex (PDB 2BAP) with the RhoC·mDiaN complex structure (1Z2C), with mDiaN shown in electrostatic surface representation (blue for positively charged surfaces, red for negatively charged surfaces, and white for neutral surfaces). Residues Glu-358, Asp-362, and Glu-366 of mDiaN are indicated. RhoC and the DAD core are displayed as yellow and green ribbons, respectively, Gpp(NH)p as stick model, and Mg2+ as sphere. The green dashed line represents the course of the C-terminal basic region of DAD as suggested from data described in the text.
FIGURE 2.
FIGURE 2.
A, sequence alignment of mDia isoforms 1-3 (SwissProt accession numbers O08808, Q9Z207, and O70566, respectively) in the region of the triple NNN- and TSH motifs of mDia1, -2, and -3. B, sequence alignment of mouse Rac1, Cdc42, and RhoA (SwissProt accession numbers P63001, P60766, and Q9QUI0, respectively) in the region around Phe-106 of RhoA. C, ribbon diagram (lower part) of the structure of the RhoC·mDiaN complex (PDB 1Z2C) with a blowup (upper part) highlighting the residues crucial for specificity, with Arg-68 and Phe-106 of RhoC and the triple NNN motif Asn-164-166 of mDiaN located in a loop between ARM1 and ARM2, with mDiaN as gray ribbons, ARM1 and ARM2 highlighted in blue, Asn-164-166 of as cyan sticks, RhoC as yellow ribbons, Arg-68 and Phe-106 as red sticks, and Gpp(NH)p·Mg2+ as orange sticks.
FIGURE 3.
FIGURE 3.
ITC analysis of the interaction between WT and mutant Rho and mDia proteins, with RhoA·Gpp(NH)p and mDiaN (A), RhoA·Gpp(NH)p and mDiaN-TSH (B), Cdc42·Gpp(NH)p and mDiaN (C), or mDiaN-TSH (D) and Cdc42(H104F)·Gpp(NH)p and mDiaN (E) or mDiaN-TSH (F).
FIGURE 4.
FIGURE 4.
Interaction of the Rho insert helix with mDiaN. A, ribbon and surface representation of the RhoC·mDiaN complex (PDB 1Z2C) with RhoC and mDiaN in yellow and cyan, respectively, in an overview (left section) and as a close-up view (right section). The Rho insert helix is colored in magenta and particular residues (Lys-133 and Met-134 of RhoC and Ile-299, Ile-344, Glu-345, and Asn-346 of mDiaN) are highlighted as sticks and interactions as dashed lines. B and C, sequence alignment of mDia isoforms and Rho proteins (accession numbers as in Fig. 2). Residues Lys-133 and Met-134 of RhoC and Ile-299, Ile-344, Glu-345, and Asn-346 of mDiaN, described in the text and depicted as sticks in A, are highlighted.
FIGURE 5.
FIGURE 5.
Structure of the Cdc42·mDiaN-TSH complex. A, ribbon and surface representation of the Cdc42·mDiaN-TSH dimer, with color coding as indicated, Gpp(NH)p as stick model and Mg2+ ions as green spheres. B, superimposition of the Cdc42·mDiaN-TSH complex structure (mDiaN-TSH colored in green and Cdc42 in pale orange) with RhoC·mDiaN complex (PDB 1Z2C, mDiaN colored in red and RhoC colored in orange), mDiaN of mDiaN·DAD complex (PDB 2BAP, mDiaN colored in blue), mDia-(131-516) (PDB 2BNX (46), colored in magenta), and mDia1-(135-367) (PDB 2F31 (44), colored in yellow). C, close-up view of the superimposition from B, highlighting the long helix α17, helix 3 of the of the fifth ARM of ARR, and the dimerization domain (Dim). D, close up view of the superimposition from B showing Cdc42 and RhoC (color coding as in B) with the Gpp(NH)p molecules as sticks.
FIGURE 6.
FIGURE 6.
Structural analysis of the Cdc42 mDiaN-TSH interaction. A, schematic drawing of interacting residues in Cdc42 and mDiaN-TSH (cutoff distance 3.6 Å). B, superimposition of the Cdc42 and the RhoC complexes in the contact area of switch I and mDiaN (color legend in figure), highlighting particular residues, including the salt bridge between Glu40R and Lys-107NNN. C, superimposition of the Cdc42 and the RhoC complexes in the contact area of switch II (color legend in figure), with water molecules displayed as gray spheres and with selected residues highlighted as sticks. For clarity, only important parts of mDiaN-TSH and Cdc42 are displayed. The switch II region of RhoC and Cdc42 is highlighted in red and salmon, respectively.
FIGURE 7.
FIGURE 7.
Structural basis of specificity. A and B, superimposition the Cdc42 and RhoC complexes with WT and mDiaN-TSH around the central portion around the NNN/TSH-motifs, with color coding as indicated. The G proteins are displayed as ribbons on a transparent surface of WT (A) or TSH-mutant (B) mDiaN, with the NNN and TSH motifs (in blue sticks) shining through. The white arrow points to a solvent-accessible tunnel present in the RhoC·mDiaN-NNN structure (A), which is closed by the larger side chain of His-166TSH in the Cdc42·mDiaN-TSH structure (B). The additional van der Waals surface provided by the larger His-166TSH side chain is highlighted in red. (B). C, ribbon and surface representation of the Cdc42·mDiaN-TSH complex around the Cdc42 insert helix, with color coding as indicated and special residues highlighted in stick representation. The Cdc42 insert helix is highlighted in magenta, and residues Lys-131C and Asn-132C are colored in orange (compare Fig. 4).

References

    1. Castrillon, D. H., and Wasserman, S. A. (1994) Development (Camb.) 120 3367-3377 - PubMed
    1. Pantaloni, D., Le Clainche, C., and Carlier, M. F. (2001) Science 292 1502-1506 - PubMed
    1. Pollard, T. D., and Borisy, G. G. (2003) Cell 112 453-465 - PubMed
    1. Bompard, G., and Caron, E. (2004) J. Cell Biol. 166 957-962 - PMC - PubMed
    1. Buck, M., Xu, W., and Rosen, M. K. (2004) J. Mol. Biol. 338 271-285 - PubMed

MeSH terms

Associated data