Review
. 2008 Oct 1;14(19):5959-66.
doi: 10.1158/1078-0432.CCR-07-4532.

Statistical challenges in preprocessing in microarray experiments in cancer

Affiliations
Review

Statistical challenges in preprocessing in microarray experiments in cancer

Kouros Owzar et al. Clin Cancer Res. .

Abstract

Many clinical studies incorporate genomic experiments to investigate the potential associations between high-dimensional molecular data and clinical outcome. A critical first step in the statistical analyses of these experiments is that the molecular data are preprocessed. This article provides an overview of preprocessing methods, including summary algorithms and quality control metrics for microarrays. Some of the ramifications and effects that preprocessing methods have on the statistical results are illustrated. The discussions are centered around a microarray experiment based on lung cancer tumor samples with survival as the clinical outcome of interest. The procedures that are presented focus on the array platform used in this study. However, many of these issues are more general and are applicable to other instruments for genome-wide investigation. The discussions here will provide insight into the statistical challenges in preprocessing microarrays used in clinical studies of cancer. These challenges should not be viewed as inconsequential nuisances but rather as important issues that need to be addressed so that informed conclusions can be drawn.


Figures

Figure 1
Figure 1
The panel in the top row illustrates the density estimates of the probe intensities for each of the 96 CEL files from Beer [8]. The PCA plots of expression values obtained when all arrays are RMA pre-processed (bottom-left panel) and when seven outlier arrays are removed (bottom-right panel)
Figure 2
Figure 2
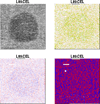
The top-left panel shows raw image of the (purple) outlier chips. The remaining three panels plot various types of residuals obtained after subtracting off a probe-level linear model.
Figure 3
Figure 3
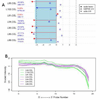
Graphical representations of summary measures for array quality. A) Output from the QC reports generated by Bioconductor/simpleaffy for the 6 outlying arrays identified in Figure 1. Percent present and average background are printed, and the scale factor, beta-actin 3’/5’ ratio, and GAPDH 3’/5’ ratio are plotted on the log2 scale. Values that cross typical thresholds are displayed in red. B) RNA degradation plots from Bioconductor/affy. For each transcript, probe pairs are ordered from 5’ to 3’, and the average position-specific PM value is plotted for each array to indicate any global patterns of sample degradation.
Figure 4
Figure 4
Bootstrap variance estimates for expression values generated from RMA. A) Boxplots of the average variance in expression across all arrays when pre-processed with 200 random standardizing sets of size N = 5, 10, 15, 20, 25, 30. Arrays were either selected from the full set of samples from Beer et al. [8], after removing outlier set 1 (purple), outliers set 2 (green), or both (yellow). B) Scatterplots of bootstrap variance estimates from standardization sets of size N = 20 with or without removing outlier samples.

Similar articles

Cited by

References

    1. Mei R, Galipeau PC, Prass C, Berno A, Ghandour G, Patil N, Wolff RK, Chee MS, Reid BJ, Lockhart DJ. Genome-wide detection of allelic imbalance using human SNPs and high-density DNA arrays. Genome Research. 2000;10(8):1126–1137. - PMC - PubMed
    1. Pollack JR, Perou CM, Alizadeh AA, Eisen MB, Pergamenschikov A, Williams CF, Jeffrey SS, Botstein D, Brown PO. Genome-wide analysis of DNA copy-number changes using cDNA microarrays. Nature Genetics. 1999;23(1):41–46. - PubMed
    1. Schena M, Shalon D, Davis RW, Brown PO. Quantitative monitoring of gene-expression patterns with a complementary-DNA microarray. Science. 1995;270(5235):467–470. - PubMed
    1. Tusher VG, Tibshirani R, Chu G. Significance analysis of microarrays applied to the ionizing radiation response. Proc Natl Acad Sci USA. 2001;98(9):5116–5121. - PMC - PubMed
    1. Barry WT, Nobel AB, Wright FA. Significance analysis of functional categories in gene expression studies: a structured permutation approach. Bioinformatics. 2005;21(9):1943–1949. - PubMed