. 2008 Oct 1;14(19):5995-6004.
doi: 10.1158/1078-0432.CCR-08-0291.

Sonic hedgehog promotes desmoplasia in pancreatic cancer

Affiliations

Sonic hedgehog promotes desmoplasia in pancreatic cancer

Jennifer M Bailey et al. Clin Cancer Res. .

Abstract

Purpose: We investigated the contribution of Sonic hedgehog (SHH) to pancreatic cancer progression.

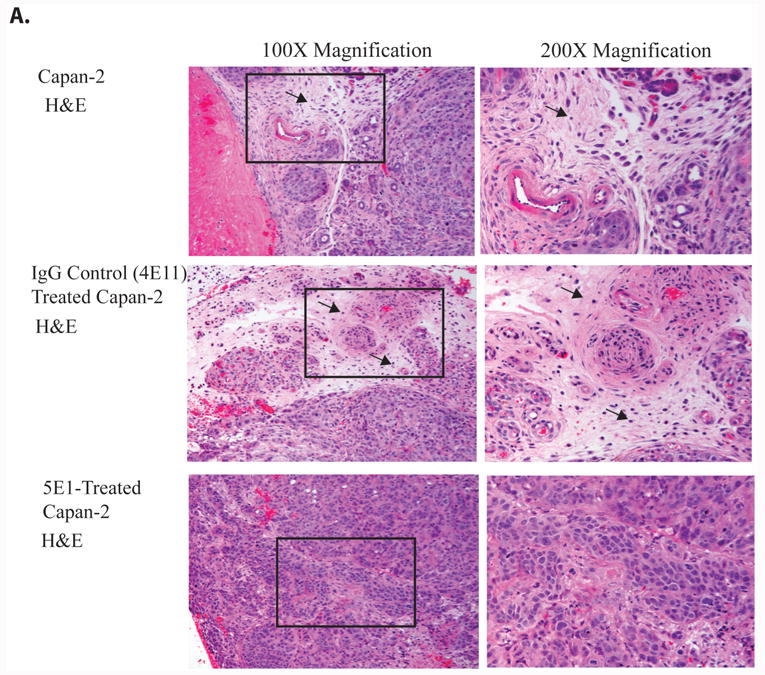
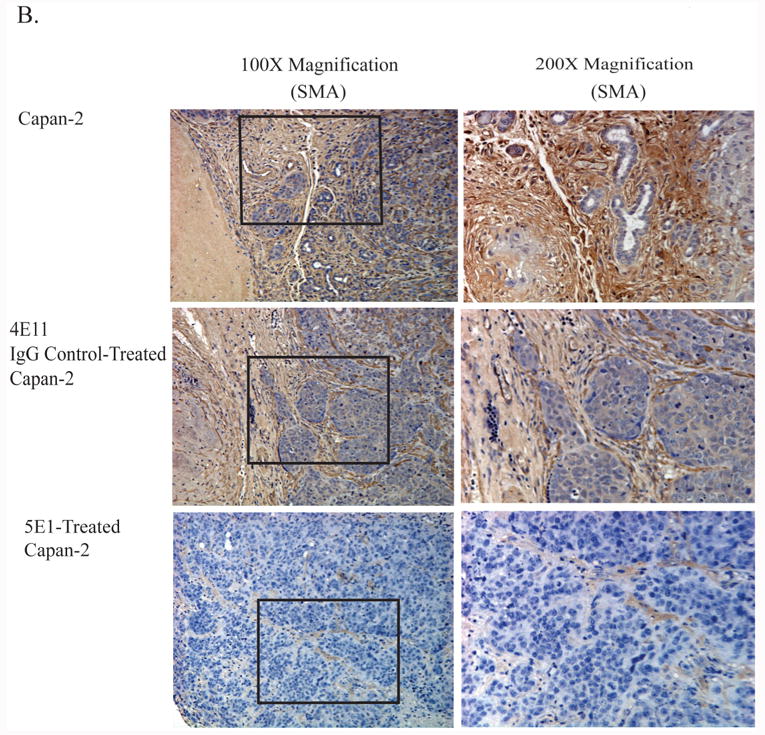
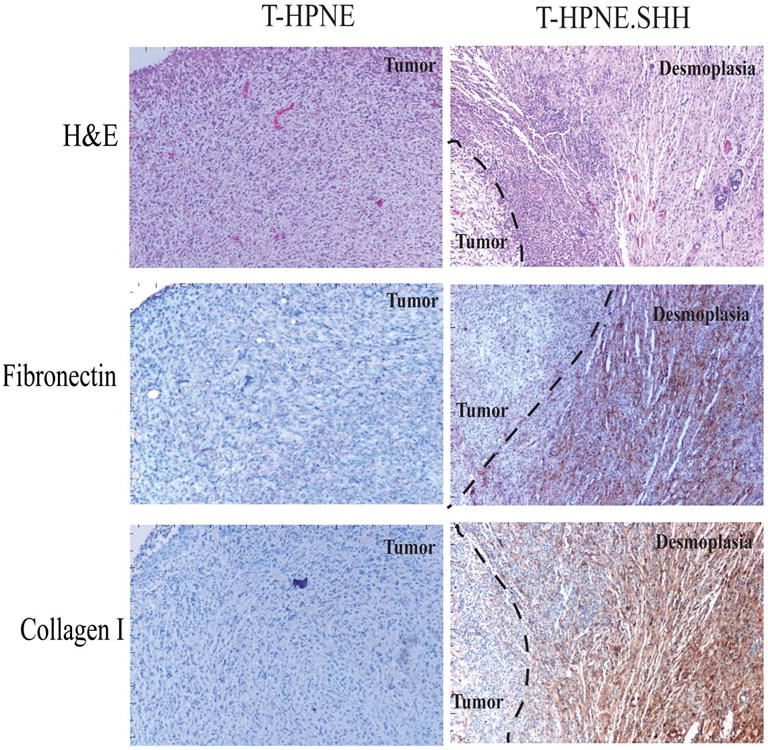
Experimental design: We expressed SHH in a transformed primary ductal-derived epithelial cell line from the human pancreas, transformed hTert-HPNE (T-HPNE), and evaluated the effects on tumor growth. We also directly inhibited the activity of SHH in vivo by administering a blocking antibody to mice challenged orthotopically with the Capan-2 pancreatic cancer cell line, which is known to express SHH and form moderately differentiated tumors in nude mice.

Results: Our data provide evidence that expression of SHH influences tumor growth by contributing to the formation of desmoplasia in pancreatic cancer. We further show that SHH affects the differentiation and motility of human pancreatic stellate cells and fibroblasts.

Conclusions: These data suggest that SHH contributes to the formation of desmoplasia in pancreatic cancer, an important component of the tumor microenvironment.


Figures

Figure 1
Figure 1. Inhibition of SHH signaling decreases desmoplasia in Capan-2 orthotopic tumors
A. Histological analysis of tumors derived following orthotopic challenge with Capan-2 and treatment with a blocking antibody for SHH (5E1), an isotype control (4E11) or no treatment (Capan-2). 100× magnification of H&E staining showing reactive stroma and desmoplasia in the Capan-2 and control 4EII- treated Capan-2 tumors (see black arrows). The 5E1 treated Capan-2 tumors showed little or no evidence of desmoplasia by histological examination. B. Immunohistochemistry using the mesenchymal marker SMA. Paraffin-embedded sections of tumors that arose from orthopic implantation of Capan-2 cells and treatment with a blocking antibody for SHH (5E1), an isotype control (4E11) or no treatment (Capan-2). Positive staining for SMA is indicated by the brown coloration. Counterstaining was performed using hematoxylin (blue). C. Morphometric quantification of the relative amount of SMA+ desmoplasia in the Capan-2 control, 4E11 and 5E1-treated tumors. The 5E1 tumors showed a significant decrease in the amount of SMA+ desmoplasia. Relative SMA+ areas on the tumor sections were quantified by calcuating the total cellular content of the section, and expressing the results as a percentage of SMA+ desmoplasia/all cell types in total area ×100. Two representing results of 5E1-treated Capan-2 primary tumors showed some staining with SMA, but the areas of staining were individualized fibroblasts representing less than 20% of the section. Inhibition of SHH significantly decreased the amount of SMA+ desmoplasia in Capan-2 tumors (n=5/group).
Figure 2
Figure 2. SHH promotes desmoplasia in an orthotopic model of pancreatic cancer
A and B. Histological analysis of orthotopic pancreatic tumors derived from the T-HPNE.SHH cell line. Tumor sections were stained for the marker SMA to determine if there was a difference in the amount of SMA+ desmoplasia in the SHH expressing tumor cells. Positive staining for SMA is indicated in brown. (A) 40× magnification of peripheral sections of T-HPNE and T-HPNE.SHH pancreatic tumors representing the large desmoplastic reaction in the periphery of the T-HPNE.SHH orthotopic tumors (note black arrows). Infiltrating SMA+ cells are also indicated with a black arrow. (B). 200× magnification. Immunohistochemical analysis using SMA to stain for myofibroblasts in the T-HPNE and T-HPNE.SHH tumor sections. Positive staining is indicated in brown and SMA+ cells are shown with the black arrows. C. Morphometric analysis of desmoplasia in T-HPNE vs. T-HPNE.SHH orthotopic tumors. Analysis was done by quantifying SMA+ areas on the tumor sections relative to the total cellular content, and expressing the results as a percentage: SMA+ desmoplasia/total area ×100. Tumors derived from the T-HPNE.SHH cell line showed significantly more desmoplasia than the tumors derived from the T-HPNE cells (n=13/ group).
Figure 3
Figure 3. Expression of Collagen 1 and Fibronectin in orthotopic tumor sections
A. Representative immunohistochemical analysis of T-HPNE and T-HPNE.SHH tumor sections to determine if Fibronectin and Collagen 1 are expressed in either of the tumor sections. Areas of desmoplasia were identified using staining for SMA (described in Figures 1 and 2). Evidence that the SMA+ areas were expressing fibronectin and collagen 1 is indicated by brown staining in the areas of the tumor sections designated desmoplasia in the T-HPNE.SHH tumor sections. We did not observe positive staining in tumors derived from the T-HPNE cell line. H&E staining of the tumor sections is also shown. B. Representative IHC staining for Collagen 1 and Fibronectin in the Capan-2 orthotopic tumors with no treatment, treatment with 4E11 or treatment with 5E1. There was a decrease in the intensity and amount of staining for both Collagen 1 and Fibronectin in the tumor sections treated with 5E1 when compared to the controls.
Figure 4
Figure 4. SHH paracrine signaling between tumor and stroma
A. Representative immunohistochemical analysis of primary pancreatic ductal adenocarcinoma tissue sections from patients with pancreatic cancer. Positive staining for Gli-1 or SHH is indicated by the brown color on the tissue sections. We observed positive staining for SHH in the tumor cells, while there was minimal staining in the tumor cells for Gli-1 (note black arrows showing positive staining; white arrows indicate negative staining). We observed minimal staining for Gli-1 in the tumor cells and observed reactivity with the Gli-1 antibody in areas of desmoplasia. B. Immunohistochemical analysis of T-HPNE.SHH tumors. 200× magnification showing both SMA and Gli-1 staining. The brown staining in adjacent sections indicates the SMA+ myofibroblasts infiltrating the T-HPNE.SHH tumor section are expressing Gli-1 (n=3).
Figure 5
Figure 5. SHH enhances pancreatic stellate cell proliferation and differentiation and enhances pancreatic myofibroblast invasion
A. Confocal microscopy of T-HPNE and T-HPNE.SHH tumors (as indicated) using anti-human ribonuclear protein (blue) and anti-SMA (green). DIC plus overlay shows that in the T-HPNE.SHH tumors, there are cells positive for SMA but not human ribonuclear protein, which indicates that the majority of the myofibroblasts are of murine origin. Confocal analysis of anti-ribonuclear protein (RNP) or SMA expression on Capan-2 control tumors and tumors treated with the 5E1 inhibitor (as indicated). The anti-human ribonuclear protein is shown in blue and SMA is in green. In the 5E1-teated Capan-2 tumors, isolated SMA+ cells can be identified as green in the overlay. B. Serial sections showing SMA and Cyclin D1 staining of SMA+ myofibroblasts in Capan-2 tumors (brown stain). C. Real time PCR analysis on markers of mesenchymal and epithelial differentiation performed on pancreatic stellate cells after 24 hour stimulation with recombinant human SHH at either 1ug/ml or 10ug/ml. SHH stimulation increased the expression of Desmin, Vimentin and Smooth muscle actin and decreased the expression of Cytokeratin 19.
Figure 6
Figure 6. SHH increases the in vitro invasive capacity of primary cells from the human pancreas
A. Invasion assay in matrigel invasion chambers. T-HPNE cells or T-HPNE.SHH cells were seeded in the lower chambers at densities of 50,000 cells/ well, 250,000 cells/ well and 500,000 cells/ well. With 250,000 and 500,000 cells, SHH secreted from the T-HPNE.SHH cell line significantly increased the invasive potential of an immortalized human pancreatic myofibroblast cell line (*p<0.05). Quantitative analysis of numbers of invasive cells for each cell line is represented in the bar graph ± SE (n=3). B. Invasion assay in matrigel invasion chambers. Recombinant SHH in the lower chamber of the invasion assay significantly increased the invasive potential of an immortalized human pancreatic myofibroblast cell line (**p< 0.01). Quantitative analysis of numbers of invasive cells for each cell line is represented in the bar graph ± SE (n=3). C and D. In vitro wound healing assay. C. Pictures of initial time point controls and 48hour time points showing the affects of SHH-stimulation on the pancreatic myofibroblasts. D. Quantitative analysis of the in vitro wound healing assay (% closure). SHH-stimulated immortalized human pancreatic myofibroblasts showed a significant increase in their ability to recover from the wound (*p=0.05). The addition of the 5E1 blocking antibody significantly inhibited the SHH-mediated wound-healing ability back to control levels (*p=0.05). Values are shown in the bar graph ±SD for each cell line.

References

    1. Jemal A, Tiwari RC, Murray T, Ghafoor A, Samuels A, Ward E, Feuer EJ, Thun MJ. Cancer statistics, 2004. CA Cancer J Clin. 2004;54:8–29. - PubMed
    1. Yeo CJ, Cameron JL, Lillemoe KD, Sohn TA, Campbell KA, Sauter PK, Coleman J, Abrams RA, Hruban RH. Pancreaticoduodenectomy with or without distal gastrectomy and extended retroperitoneal lymphadenectomy for periampullary adenocarcinoma, part 2: randomized controlled trial evaluating survival, morbidity, and mortality. Ann Surg. 2002;236:355–366. discussion 366-358. - PMC - PubMed
    1. Hruban RH, Goggins M, Parsons J, Kern SE. Progression model for pancreatic cancer. Clin Cancer Res. 2000;6:2969–2972. - PubMed
    1. Kayed H, Kleeff J, Osman T, Keleg S, Buchler MW, Friess H. Hedgehog signaling in the normal and diseased pancreas. Pancreas. 2006;32:119–129. - PubMed
    1. Thayer SP, di Magliano MP, Heiser PW, Nielsen CM, Roberts DJ, Lauwers GY, Qi YP, Gysin S, Fernandez-del Castillo C, Yajnik V, Antoniu B, McMahon M, Warshaw AL, Hebrok M. Hedgehog is an early and late mediator of pancreatic cancer tumorigenesis. Nature. 2003;425:851–856. - PMC - PubMed

Substances