. 2008 Dec;100(6):3144-57.
doi: 10.1152/jn.90424.2008. Epub 2008 Oct 1.

Development of theta rhythmicity in entorhinal stellate cells of the juvenile rat

Affiliations

Development of theta rhythmicity in entorhinal stellate cells of the juvenile rat

Brian G Burton et al. J Neurophysiol. 2008 Dec.

Abstract

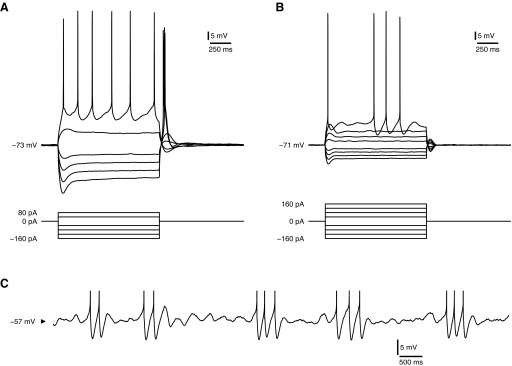
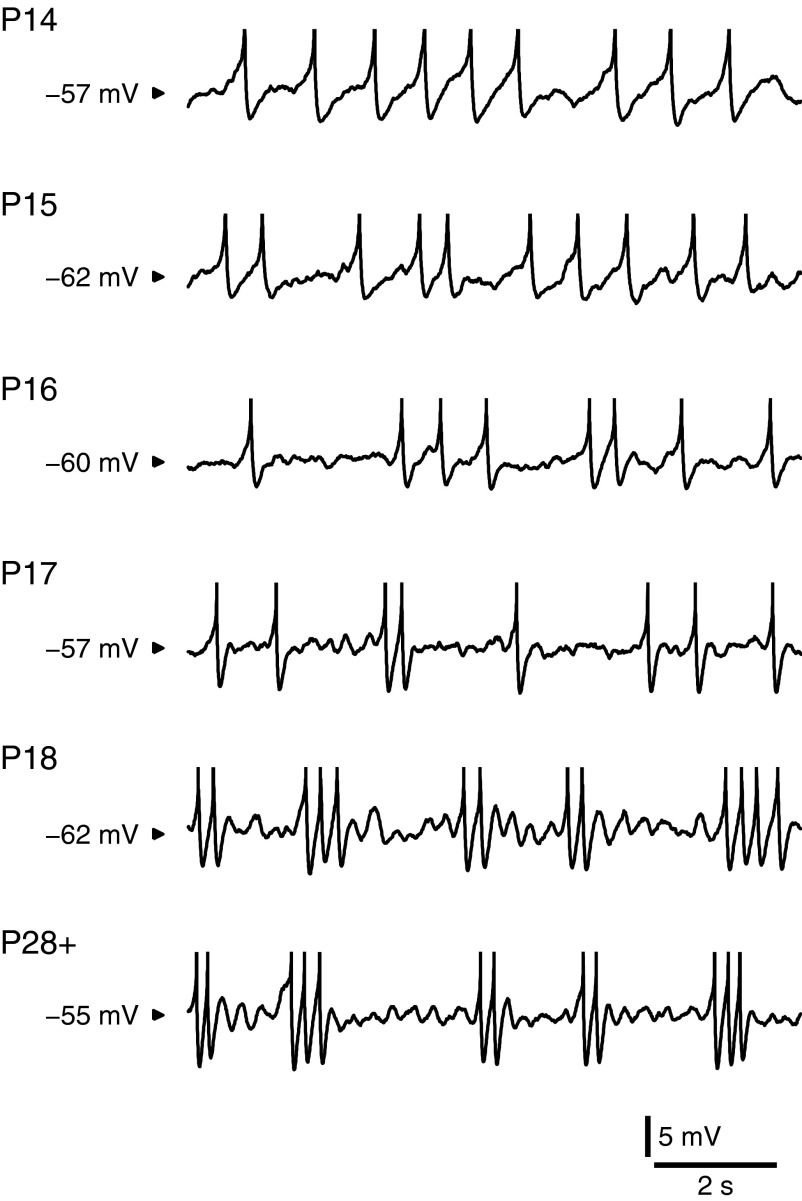
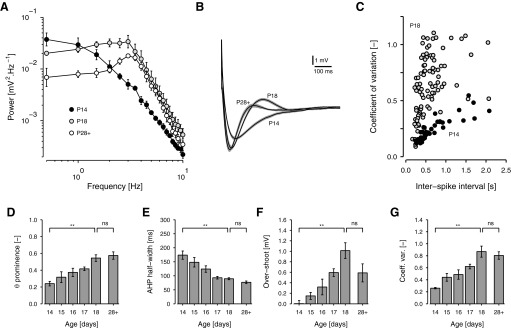
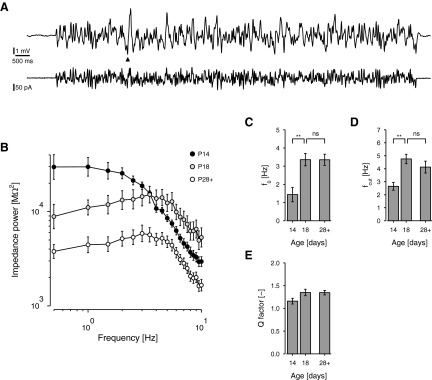
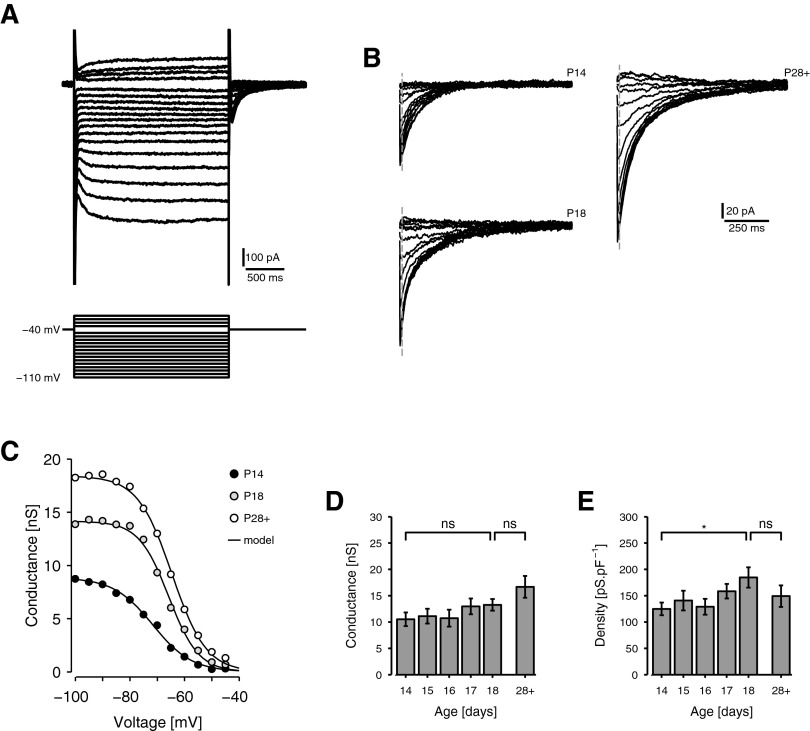
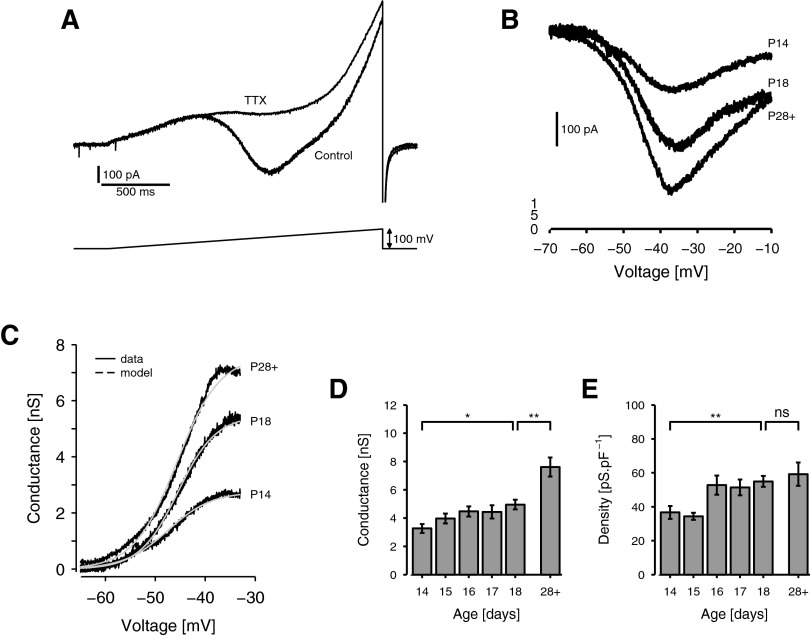
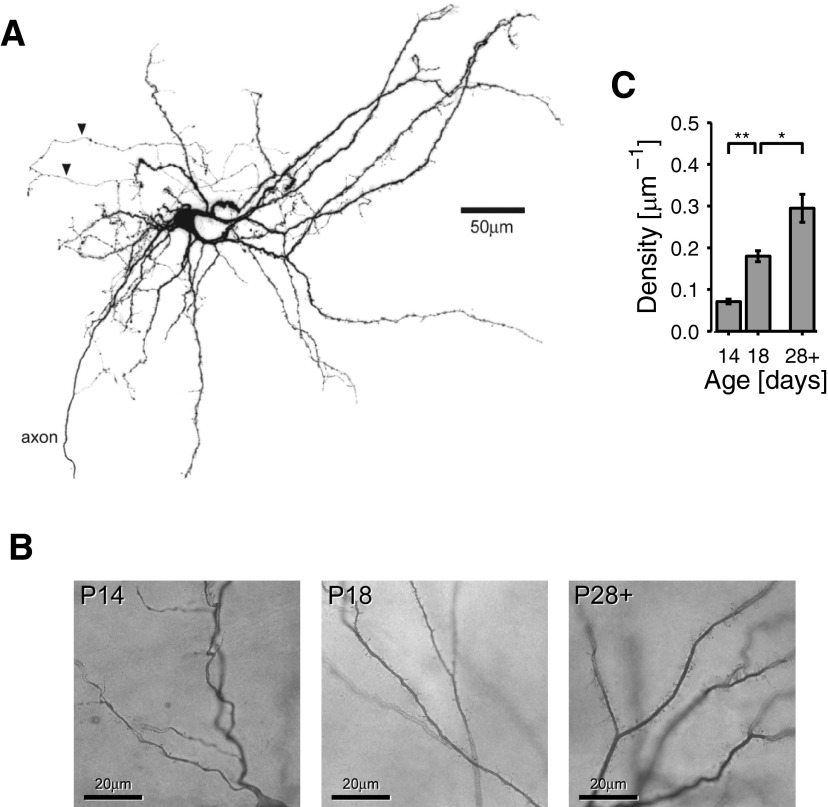
Mature stellate cells of the rat medial entorhinal cortex (EC), layer II, exhibit subthreshold membrane potential oscillations (MPOs) at theta frequencies (4-12 Hz) in vitro. We find that MPOs appear between postnatal days 14 (P14) and 18 (P18) but show little further change by day 28+ (P28-P32). To identify the factors responsible, we examined the electrical responses of developing stellate cells, paying attention to two currents thought necessary for mature oscillation: the h current I(h), which provides the slow rectification required for resonance; and a persistent sodium current I(NaP), which provides amplification of resonance. Responses to injected current revealed that P14 cells were often nonresonant with a relatively high resistance. Densities of I(h) and I(NaP) both rose by about 50% from P14 to P18. However, I(h) levels fell to intermediate values by P28+. Given the nonrobust trend in I(h) expression and a previously demonstrated potency of even low levels of I(h) to sustain oscillation, we propose that resonance and MPOs are limited at P14 more by low levels of I(NaP) than of I(h). The relative importance of I(NaP) for the development of MPOs is supported by simulations of a conductance-based model, which also suggest that general shunt conductance may influence the precise age when MPOs appear. In addition to our physiological study, we analyzed spine densities at P14, P18, and P28+ and found a vigorous synaptogenesis across the whole period. Our data predict that functions that rely on theta rhythmicity in the hippocampal network are limited until at least P18.


Figures

FIG. 1.
FIG. 1.
Physiological characteristics of stellate cells. A and B: current-step responses of immature (postnatal day 14 [P14]; A) and mature (P28; B) stellate cells from medial entorhinal cortex, layer II. Steps start at −160 pA and increment by 40 pA until spike threshold is exceeded. Stellate cells were identified on the basis of size, location, and somatodendritic shape (Klink and Alonso 1997). However, even by P14, they were distinguishable within layer II by a repolarizing sag in response to negative current and early spikes in response to positive current. C: responses of a mature stellate cell to constant depolarizing current (200 pA). Same cell as in B. Spikes are clipped for presentation purposes. Mature stellate cells exhibit subthreshold oscillation and clustered spiking.
FIG. 2.
FIG. 2.
The development of oscillatory behavior in stellate cells. Example traces recorded from stellate cells in response to constant current at 6 different days of development, as indicated. Traces are roughly matched for firing rate. At P14 and P15, action potentials occurred somewhat regularly and had a long afterhyperpolarization (AHP). At P16 and P17 action potentials began to cluster, the AHP shortened, and oscillations appeared between spikes. By P18 an adult physiology was obtained, resembling that at P28+ (P28–P32). Spikes were highly clustered and oscillations were strong.
FIG. 3.
FIG. 3.
Response statistics of developing stellate cells. A: mean power spectral densities (with SE bars) of membrane potential under perithreshold current in cells at P14, P18, and P28+ (n = 4, 6, 4). From P14 to P18, power at about 3 Hz increased steadily, producing a prominent peak by P18. Beyond P18, overall power fell, although the concentration of power at theta frequencies was maintained. B: mean spike AHPs of cells at P14, P18, and P28+ (n = 4, 7, 8). The perispike waveform of cells firing at <2 Hz was averaged for each cell, ignoring spikes followed immediately by a second spike. From these waveforms, the potential from 700 ms to 1 s after the spike was subtracted and the mean across cells calculated. The gray shadow indicates the SE of this second average. With age, the AHP shortened and deepened and an overshoot developed. C: the coefficient of variation (CV = SD ÷ mean) of the interspike interval (ISI), plotted against ISI for all trials collected from cells at P14 (filled circles, n = 4) and P18 (light gray circles, n = 7). Because of the development of spike clusters, the older cells have a higher CV. D: histogram of theta prominence as a function of age (P14 to P18 and P28+, n = 4, 4, 5, 9, 6, 4), where prominence indicates the proportion of total power contained between 2 and 4 Hz. E and F: histograms of AHP half-width (E) and overshoot amplitude (F) as a function of age (P14 to P18 and P28+, n = 4, 5, 7, 14, 7, 8). Half-width is the width of the AHP at half the minimum potential, measured relative to the potential between 700 ms and 1 s after the spike. Overshoot is the maximum potential. G: histogram of mean coefficient of variation of ISI at spike intervals in the range 0.5 to 1.0 s, as a function of age (P14 to P18 and P28+, n = 4, 5, 7, 12, 7, 8). DG: here and elsewhere, a bracket above P14 to P18 indicates the significance of either a trend analysis or the difference between the values at P14 and P18, as appropriate (methods). A bracket above P18 and P28+ compares these days separately. NS, not significant; *P < 0.05/3, **P < 0.01/3 (see methods). Error bars are SEs.
FIG. 4.
FIG. 4.
Response to injected current. A: mean response (above) of an example cell from a P29 rat in response to the presentation of a white noise current stimulus (below) at −67 mV. Mean response is an average of 8. To avoid the influence of the cell's transient response on impedance measurements, only the last 10 s, starting from the arrowhead, were used to estimate membrane impedance (methods). B: mean impedance power spectra (square of impedance amplitude) obtained from white noise responses for cells from rats at P14, P18, and P28+, as indicated. P14 cells were mainly low-pass. CE: impedance parameters (P14, P18, and P28+, n = 8, 7, 10). C: frequency of maximum impedance, f0. D: cutoff frequency, fcut. E: Q-factor (maximum amplitude divided by amplitude at 0.5 Hz).
FIG. 5.
FIG. 5.
Development of the expression of Ih. A and B: voltage-step protocol for isolating the h current, Ih. A: current responses of an example stellate cell (P32) to 2-s voltage steps, applied from a holding of −40 mV, in the presence of Na+, K+, and Ca2+ channel blockers. B: the magnified tail currents of 3 representative cells at P14, P18, and P28+ (same cell as in A). The vertical dashed line indicates the point at which amplitudes are measured. Tail current amplitude reflects the decay of the h conductance from its steady-state step value to its value at the holding potential. C: activation curves of the h-conductance, gh, for the cells in B. The tail current magnitude for the highest voltage step is subtracted from all others and the results are adjusted for electromotive force (emf) to indicate conductance as a function of voltage (discs). The data are then fitted with a Boltzmann curve (model). D and E: histograms of conductance amplitude (D) and density (E) of Ih from P14 to P18 and at P28+ (n = 15, 18, 8, 15, 18, 5). D: the absolute Ih conductance increased throughout the period studied. E: Ih conductance density increased somewhat from P14 to P18 but was intermediate at P28+.
FIG. 6.
FIG. 6.
Development of the expression of INaP. A: voltage-ramp protocol for isolating the persistent sodium current, INaP. Current responses of an example stellate cell (P18) to a 50 mV·s−1 voltage ramp, applied from a holding of −95 mV, before (control) and after (tetrodotoxin [TTX]) the addition of 1 μM TTX to the bath. B: isolated persistent sodium currents as a function of voltage for representative cells at P14, P18 (same cell as in A), and P28+. Currents are calculated by subtracting TTX ramp responses from control ramp responses and mapping time onto voltage according to ramp speed. C: activation curve of the persistent sodium conductance, gNaP, for the cells in B. The current–voltage functions in B are adjusted for emf to indicate gNaP as a function of voltage (black) and the results fitted with a Boltzmann curve (gray). D and E: histograms of conductance amplitude (D) and density (E) of INaP at P14 to P18 and P28+ (n = 11, 12, 21, 11, 18, 12). D: the absolute INaP conductance increased steadily from P14 to P18 and beyond. E: INaP conductance density also increased steadily from P14 to P18, but there was little further change in the mature animal.
FIG. 7.
FIG. 7.
Anatomical development of stellate cells. A: stellate morphology. P14 stellate cell filled with Alexa Fluor 488 and displaying typical stellate morphology, including strong primary dendrites extending superficially to the pial surface, dendritic spines, and fine axon collaterals (arrowheads) in the vicinity of the soma. An axon projects from a basal primary dendrite, eventually to send collaterals in layers III and VI (cropped). B and C: spine growth. B: photomicrographs of example DAB-stained cells at P14, P18, and P30, showing an increase in spine density. C: histogram of mean spine density in cells at P14 (n = 3), P18 (n = 3), and P28+ (n = 5).

Similar articles

Cited by

References

    1. Alonso A, García-Austt E. Neuronal sources of theta rhythm in the entorhinal cortex of the rat. I. Laminar distribution of theta field potentials. Exp Brain Res 67: 493–501, 1987. - PubMed
    1. Alonso A, Klink R. Differential electroresponsiveness of stellate and pyramidal-like cells of medial entorhinal cortex layer II. J Neurophysiol 70: 128–143, 1993. - PubMed
    1. Alonso A, Llinás RR. Subthreshold Na+-dependent theta-like rhythmicity in stellate cells of entorhinal cortex layer II. Nature 342: 175–177, 1989. - PubMed
    1. Ben-Ari Y Developing networks play a similar melody. Trends Neurosci 24: 353–359, 2001. - PubMed
    1. Bender RA, Brewster A, Santoro B, Ludwig F, Biel M, Baram TZ. Differential and age-dependent expression of hyperpolarization-activated, cyclic nucleotide-gated cation channel isoforms 1–4 suggests evolving roles in the developing rat hippocampus. Neuroscience 106: 689–698, 2001. - PMC - PubMed

Publication types