. 2009 Jan;296(1):C25-46.
doi: 10.1152/ajpcell.00094.2008. Epub 2008 Oct 1.

Role of NADH/NAD+ transport activity and glycogen store on skeletal muscle energy metabolism during exercise: in silico studies

Affiliations

Role of NADH/NAD+ transport activity and glycogen store on skeletal muscle energy metabolism during exercise: in silico studies

Yanjun Li et al. Am J Physiol Cell Physiol. 2009 Jan.

Abstract

Skeletal muscle can maintain ATP concentration constant during the transition from rest to exercise, whereas metabolic reaction rates may increase substantially. Among the key regulatory factors of skeletal muscle energy metabolism during exercise, the dynamics of cytosolic and mitochondrial NADH and NAD+ have not been characterized. To quantify these regulatory factors, we have developed a physiologically based computational model of skeletal muscle energy metabolism. This model integrates transport and reaction fluxes in distinct capillary, cytosolic, and mitochondrial domains and investigates the roles of mitochondrial NADH/NAD+ transport (shuttling) activity and muscle glycogen concentration (stores) during moderate intensity exercise (60% maximal O2 consumption). The underlying hypothesis is that the cytosolic redox state (NADH/NAD+) is much more sensitive to a metabolic disturbance in contracting skeletal muscle than the mitochondrial redox state. This hypothesis was tested by simulating the dynamic metabolic responses of skeletal muscle to exercise while altering the transport rate of reducing equivalents (NADH and NAD+) between cytosol and mitochondria and muscle glycogen stores. Simulations with optimal parameter estimates showed good agreement with the available experimental data from muscle biopsies in human subjects. Compared with these simulations, a 20% increase (or approximately 20% decrease) in mitochondrial NADH/NAD+ shuttling activity led to an approximately 70% decrease (or approximately 3-fold increase) in cytosolic redox state and an approximately 35% decrease (or approximately 25% increase) in muscle lactate level. Doubling (or halving) muscle glycogen concentration resulted in an approximately 50% increase (or approximately 35% decrease) in cytosolic redox state and an approximately 30% increase (or approximately 25% decrease) in muscle lactate concentration. In both cases, changes in mitochondrial redox state were minimal. In conclusion, the model simulations of exercise response are consistent with the hypothesis that mitochondrial NADH/NAD+ shuttling activity and muscle glycogen stores affect primarily the cytosolic redox state. Furthermore, muscle lactate production is regulated primarily by the cytosolic redox state.


Figures

Fig. 1.
Fig. 1.
Schematic diagram of the structure of the model for blood-tissue cell exchange and cellular metabolism in skeletal muscle. The compartments are assumed to be perfectly mixed, and the capillary blood and tissue interstitial fluid (ISF) domains are assumed to be in phase-equilibrium with each other so that Cisf,j = Cbl,j = Cven,j for any chemical species j. The tissue cells domain is further compartmentalized into the cytosolic and mitochondrial domains with the chemical species having distinct dynamics in these 2 subcellular domains. A total of 9 species [glucose (Glc), lactate (Lac), pyruvate (Pyr), alanine (Ala), free fatty acid (FFA), glycerol (Glr), CO2, O2, and H+ (protons)] undergo blood-cytosol exchange, and 11 species [Pyr, fatty acyl-CoA (FAC), CoA, reduced nicotinamide adenine dinucleotide (NADH), oxidized nicotinamide adenine dinucleotide (NAD+), ATP, ADP, inorganic phosphate (Pi), CO2, O2, and H+] undergo cytosol-mitochondria exchange.
Fig. 2.
Fig. 2.
Schematic diagram of biochemical pathways depicting various chemical reactions and species involved in the cellular metabolism of skeletal muscle. The reactions and species are further compartmentalized into the cytosolic and mitochondrial reactions and species. Gly, glycogen; G6P, glucose-6-phosphate; F6P, fructose-6-phosphate; F16BP, fructose-1,6-biphosphate; GA3P, glyceraldehyde-3-phosphate; 13BPG, 1,3-biphosphate glycerate; PEP, phosphoenolpyruvate; Gr3P, glycerol-3-phosphate; Tgl, triglycerides; ACoA, acetyl-CoA; Cit, citrate; AKG, α-ketogluterate; SCoA, succinyl-CoA; Suc, succinate; Mal, malate; Oxa, oxaloacetate; CoA, coenzyme-A (free); PCr, phosphocreatine; Cr, creatine; FADH2, reduced flavin adenine dinucleotide; FAD, oxidized flavin adenine dinucleotide; CK, creatine kinase; AK, adenylate kinase; HK, hexokinase; PFK, phosphofructokinase; LDH, lactate dedrogenase; PDH, pyruvate dehydrogenase. ETC+OxPhos, electron transport chain plus oxidative phosphorylation.
Fig. 3.
Fig. 3.
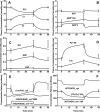
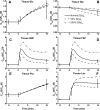
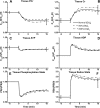
Model-predicted dynamic responses of PCr, Cr, and Pi (A), ATP, ADP, and AMP (B), Glc, G6P, and F6P (C), Lac and Pyr (D), (Lac/Pyr)cyt, (NADH/NAD+)cyt, and (NADH/NAD+)mit (E), and PCr/Cr, (ATP/ADP)cyt, and (ATP/ADP)mit (F) in muscle tissue cells (where cyt and mit indicate cytosolic and mitochondrial ratios, respectively) during the resting, ischemia, and recovery periods with a blood flow reduction level of ∼80% and their comparison to the available experimental data (48). The lines represent the model simulation results with the symbols representing the experimental data points (means ± SD). The responses were computed using the estimated optimal parameter values with the ischemia protocol of −5 to 0 min of resting, 0 to 30 min of ischemia, and 30 to 50 min of recovery. The muscle blood flow Q is reduced as a step from 0.9 l/min at rest to Qisch = 0.18 l/min at the onset of ischemia and returned to 0.9 l/min at the onset of recovery. The species concentrations in muscle tissue cells were calculated based on the volume-average formula: Ctis = (VcytCcyt + VmitCmit)/Vtis (see text for definitions).
Fig. 4.
Fig. 4.
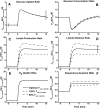
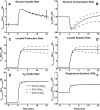
Model-predicted dynamic responses of cellular total O2 content (O2 tot) and O2 partial pressure (Po2) (A), cellular O2 uptake (Jbl↔cyt,O2), mitochondrial O2 uptake (Jcyt↔mit,O2), and mitochondrial O2 consumption (Umit,O2) (B), ATP consumption via ATP hydrolysis, ATP production via ATP synthesis, ATP production via CK, and ATP production via glycolysis (C), and cytosolic and mitochondrial pH (D) during the resting, ischemia, and recovery periods with a blood flow reduction of ∼80%. The responses were computed using the estimated optimal parameter values with the following ischemia protocol: if (t < 0 min|t > 30 min), then Q = 0.9 l/min, else Q = Qisch = 0.18 l/min, as detailed in the legend to Fig. 3.
Fig. 5.
Fig. 5.
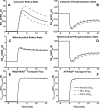
Model-predicted dynamic responses of cellular O2tot and Po2 (A), Jbl↔cyt, O2, Jcyt↔mit, O2, and Umit,O2 (B), ATP consumption via ATP hydrolysis (hyd), ATP production via ATP synthesis (syn), ATP production via CK, and ATP production via glycolysis (C), and cytosolic and mitochondrial pH (D) during the moderate intensity exercise [60% maximal O2 consumption (V̇o2max)] period. The responses were computed using the estimated optimal parameter values.
Fig. 6.
Fig. 6.
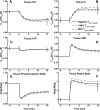
Model-predicted dynamic responses of Glc (A), Gly (B), G6P (C), F6P (D), Pyr (E), and Lac (F) in muscle tissue cells to moderate intensity exercise (60% V̇o2 max) and to variations in mitochondrial NADH/NAD+ transporter (shuttling) activity parameter (Tcyt↔mit,RS) and their comparison to the available experimental data (Glc, G6P, F6P, Pyr, and Lac obtained from Ref. ; Gly obtained from Ref. 76). The lines represent the model simulation results with the symbols representing the experimental data points (means ± SD). The responses were computed using the optimal parameter estimates. The species concentrations (mmol/kg wet weight or mM) in the muscle tissue cells were calculated based on the volume-average formula: Ctis = (VcytCcyt + VmitCmit)/Vtis and were normalized with respect to the resting species tissue cell concentrations: [Glc]cl,0 = 0.5 mM (A), [Gly]cl,0 = 95.0 mM (B), [G6P]cl,0 = 0.25 mM (C), [F6P]cl,0 = 0.044 mM (D), [Pyr]cl,0 = 0.05 mM (E), and [Lac]cl,0 = 0.78 mM (F).
Fig. 7.
Fig. 7.
Model-predicted dynamic responses of glucose uptake (Jbl↔cyt,Glc) (A), glucose consumption (φHK) (B), lactate production (φLDH) (C), lactate release (Jbl↔cyt,Lac) (D), O2 uptake (Jbl↔cyt,O2) (E), and respiratory quotient (RQ = −Jbl↔cyt,CO2/Jbl↔cyt,O2) (F) in muscle tissue cells to moderate intensity exercise (60% V̇o2 max) and to variations in mitochondrial NADH/NAD+ transporter (shuttling) activity parameter (Tcyt↔mit,RS) and their comparison to the available experimental data (76). The lines represent the model simulation results with the symbols representing the experimental data points (means ± SD). The responses were computed using the optimal parameter estimates. The transport and reaction fluxes (mmol/min) were normalized with respect to the resting transport and reaction fluxes: Jbl↔cyt,Glc,0 = 0.195 mmol/min (A), φHK,0 = 0.195 mmol/min (B), φLDH,0 = 0.09 mmol/min (C), Jbl↔cyt,Lac,0 = 0.09 mmol/min (D), and Jbl↔cyt,O2,0 = 2.42 mmol/min (E).
Fig. 8.
Fig. 8.
Model-predicted dynamic responses of PCr (A), Cr (B), ATP (C), ADP (D), phosphorylation state (ATP/ADP, PS) (E), and redox state (NADH/NAD+, RS) (F) in muscle tissue cells to moderate intensity exercise (60% V̇o2 max) and to variations in mitochondrial NADH/NAD+ transporter (shuttling) activity parameter (Tcyt↔mit,RS) and their comparison to the available experimental data (PCr and Cr obtained from Ref. ; RS obtained from Ref. 75). The lines represent the model simulation results with the symbols representing the experimental data points (means ± SD). The responses were computed using the optimal parameter estimates. The species concentrations (mmol/kg wet weight or mM) in the muscle tissue cells were calculated based on the volume-average formula Ctis = (VcytCcyt + VmitCmit)/Vtis and were normalized with respect to the resting species tissue cells concentrations: [PCr]cl,0 = 20 mM (A), [Cr]cl,0 = 10.5 mM (B), [ATP]cl,0 = 6.2 mM (C), [ADP]cl,0 = 0.8 mM (D), [PS]cl,0 = ([ATP]/[ADP])cl,0 = 7.75 (E), and [RS]cl,0 = ([NADH]/[NAD+])cl,0 = 0.111 (F).
Fig. 9.
Fig. 9.
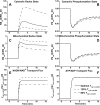
Model-predicted dynamic responses of cytosolic redox state (NADHcyt/NAD+cyt, RScyt) (A), cytosolic phosphorylation state (ATPcyt/ADPcyt, PScyt) (B), mitochondrial redox state (NADHmit/NAD+mit, RSmit) (C), mitochondrial phosphorylation state (ATPmit/ADPmit, PSmit) (D), mitochondrial NADH/NAD+ transport (shuttle) flux (Jcyt↔mit,RS) (E), and mitochondrial ATP/ADP transport flux (Jcyt↔mit,PS) (F) to moderate intensity exercise (60% V̇o2 max) and to variations in mitochondrial NADH/NAD+ transporter (shuttling) activity parameter (Tcyt↔mit,RS). The responses were computed using the optimal parameter estimates. Experimental data for these key state variables were not available in the literature for comparison. These state variables were normalized with respect to their resting values: [RS]cyt,0 = [NADH]cyt,0/[NAD+]cyt,0 = 0.00185 (A), [PS]cyt,0 = [ATP]cyt,0/[ADP]cyt,0 = 332.2 (B), [RS]mit,0 = [NADH]mit,0/[NAD+]mit,0 = 0.159 (C), [PS]mit,0 = [ATP]mit,0/[ADP]mit,0 = 1.11 (D), Jcyt↔mit,RS,0 = 0.284 (E), and Jcyt↔mit,PS,0 = 11.58 (F).
Fig. 10.
Fig. 10.
Model-predicted dynamic responses of Glc (A), Gly (B), G6P (C), F6P (D), Pyr (E), and Lac (F) in muscle tissue cells to moderate intensity exercise (60% V̇o2 max) and to variations in the initial level of muscle glycogen store ([Gly]0) and their comparison to the available experimental data. The other details are the same as those described in the legend to Fig. 6.
Fig. 11.
Fig. 11.
Model-predicted dynamic responses of Jbl↔cyt,Glc (A), φHK (B), φLDH (C), Jbl↔cyt,Lac (D), Jbl↔cyt,O2 (E), and RQ (F) in muscle tissue cells to moderate intensity exercise (60% V̇o2 max) and to variations in [Gly]0 and their comparison to the available experimental data. The other details are the same as those described in the legend to Fig. 7.
Fig. 12.
Fig. 12.
Model-predicted dynamic responses of PCr (A), Cr (B), ATP (C), ADP (D), PS (E), and RS (F) in muscle tissue cells to moderate intensity exercise (60% V̇o2 max) and to variations in [Gly]0 and their comparison to the available experimental data. The other details are the same as those described in the legend to Fig. 8.
Fig. 13.
Fig. 13.
Model-predicted dynamic responses of RScyt (A), PScyt (B), RSmit (C), PSmit (D), Jcyt↔mit,RS (E), and Jcyt↔mit,PS (F) to moderate intensity exercise (60% V̇o2 max) and to variations in [Gly]0. The other details are the same as those described in the legend to Fig. 9.

Similar articles

Cited by

References

    1. Ahlborg G, Felig P, Hagenfeldt L, Hendler R, Wahren J. Substrate turnover during prolonged exercise in man. Splanchnic and leg metabolism of glucose, free fatty acids, and amino acids. J Clin Invest 53: 1080–1090, 1974. - PMC - PubMed
    1. Ainscow EK, Brand MD. Top-down control analysis of ATP turnover, glycolysis and oxidative phosphorylation in rat hepatocytes. Eur J Biochem 263: 671–685, 1999. - PubMed
    1. Alberty RA Calculation of standard transformed Gibbs energies and standard transformed enthalpies of biochemical reactants. Arch Biochem Biophys 353: 116–130, 1998. - PubMed
    1. Alberty RA Thermodynamics of Biochemical Reactions. Hoboken, NJ: John Wiley & Sons, 2003.
    1. Balaban RS Regulation of oxidative phosphorylation in the mammalian cell. Am J Physiol Cell Physiol 258: C377–C389, 1990. - PubMed

Publication types

MeSH terms