

Top-down control of human visual cortex by frontal and parietal cortex in anticipatory visual spatial attention
- PMID: 18829963
- PMCID: PMC2583122
- DOI: 10.1523/JNEUROSCI.1776-08.2008
Top-down control of human visual cortex by frontal and parietal cortex in anticipatory visual spatial attention
Abstract
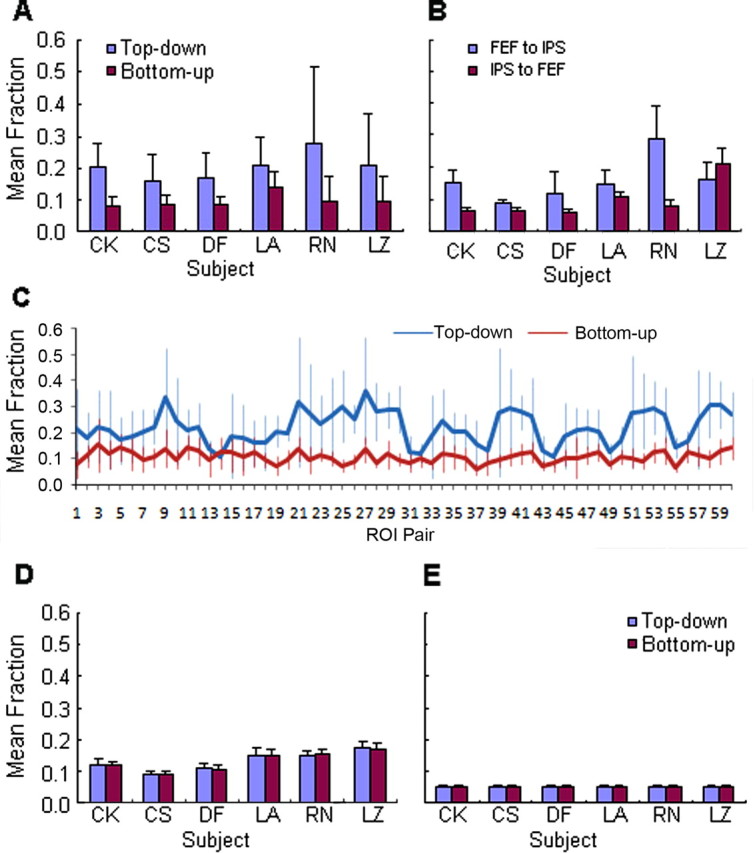
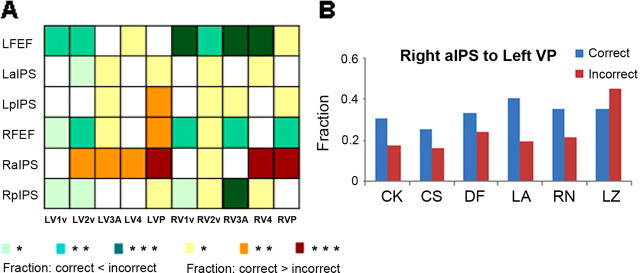
Advance information about an impending stimulus facilitates its subsequent identification and ensuing behavioral responses. This facilitation is thought to be mediated by top-down control signals from frontal and parietal cortex that modulate sensory cortical activity. Here we show, using Granger causality measures on blood oxygen level-dependent time series, that frontal eye field (FEF) and intraparietal sulcus (IPS) activity predicts visual occipital activity before an expected visual stimulus. Top-down levels of Granger causality from FEF and IPS to visual occipital cortex were significantly greater than both bottom-up and mean cortex-wide levels in all individual subjects and the group. In the group and most individual subjects, Granger causality was significantly greater from FEF to IPS than from IPS to FEF, and significantly greater from both FEF and IPS to intermediate-tier than lower-tier ventral visual areas. Moreover, top-down Granger causality from right IPS to intermediate-tier areas was predictive of correct behavioral performance. These results suggest that FEF and IPS modulate visual occipital cortex, and FEF modulates IPS, in relation to visual attention. The current approach may prove advantageous for the investigation of interregional directed influences in other human brain functions.
Figures
Comment in
-
Top-down influences of spatial attention in visual cortex.J Neurosci. 2009 Feb 11;29(6):1597-8. doi: 10.1523/JNEUROSCI.5611-08.2009. J Neurosci. 2009. PMID: 19211866 Free PMC article. Review. No abstract available.
References
-
- Bashinski HS, Bacharach VR. Enhancement of perceptual sensitivity as the result of selectively attending to spatial locations. Percept Psychophys. 1980;28:241–248. - PubMed
-
- Buschman TJ, Miller EK. Top-down versus bottom-up control of attention in the prefrontal and posterior parietal cortices. Science. 2007;315:1860–1862. - PubMed
-
- Chelazzi L, Biscaldi M, Corbetta M, Peru A, Tassinari G, Berlucchi G. Oculomotor activity and visual spatial attention. Behav Brain Res. 1995;71:81–88. - PubMed
-
- Corbetta M, Shulman GL. Control of goal-directed and stimulus-driven attention in the brain. Nat Rev Neurosci. 2002;3:201–215. - PubMed
-
- Desimone R, Duncan J. Neural mechanisms of selective visual attention. Annu Rev Neurosci. 1995;18:193–222. - PubMed
Publication types
MeSH terms
Grants and funding
LinkOut - more resources
Full Text Sources