Comparative Study
. 2008 Oct 1;28(40):10151-66.
doi: 10.1523/JNEUROSCI.2432-08.2008.

Spontaneous and evoked glutamate release activates two populations of NMDA receptors with limited overlap

Affiliations
Comparative Study

Spontaneous and evoked glutamate release activates two populations of NMDA receptors with limited overlap

Deniz Atasoy et al. J Neurosci. .

Abstract

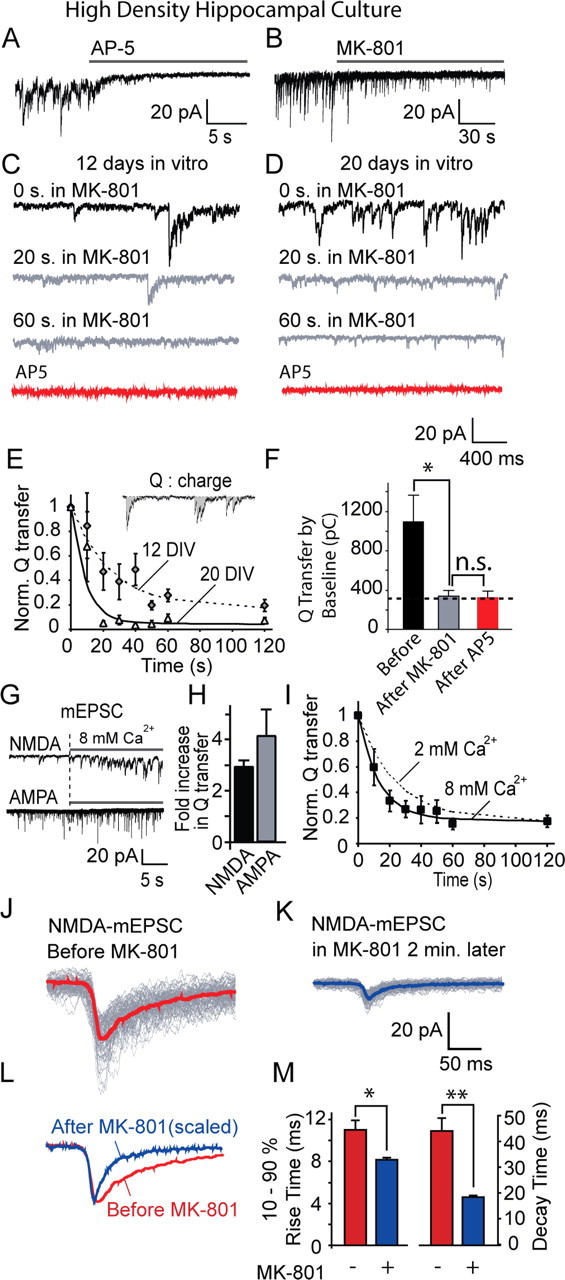
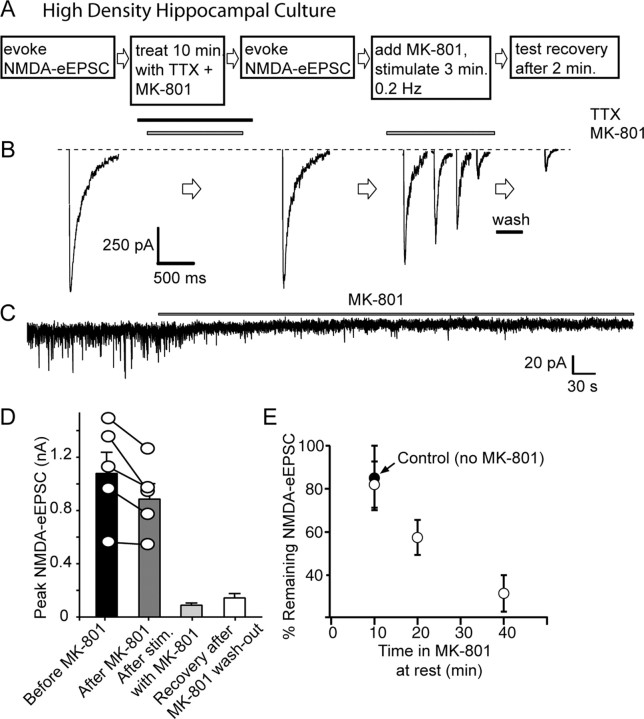
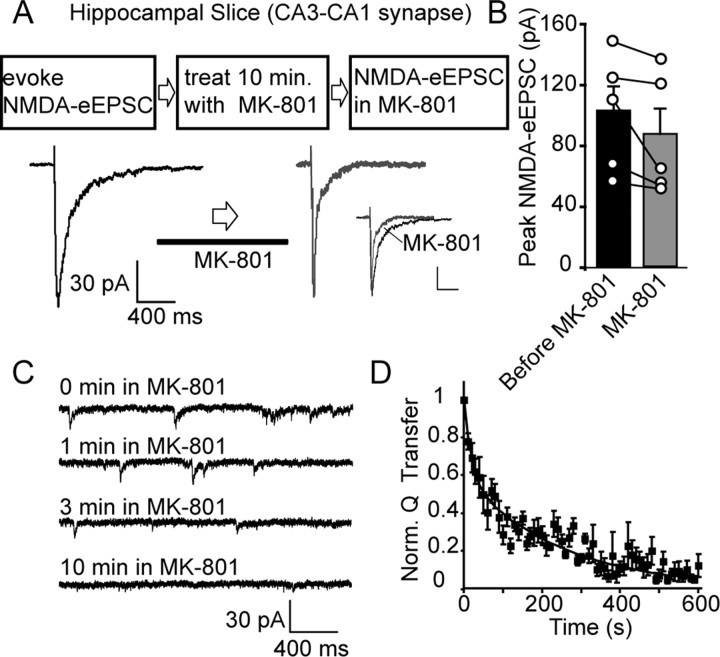
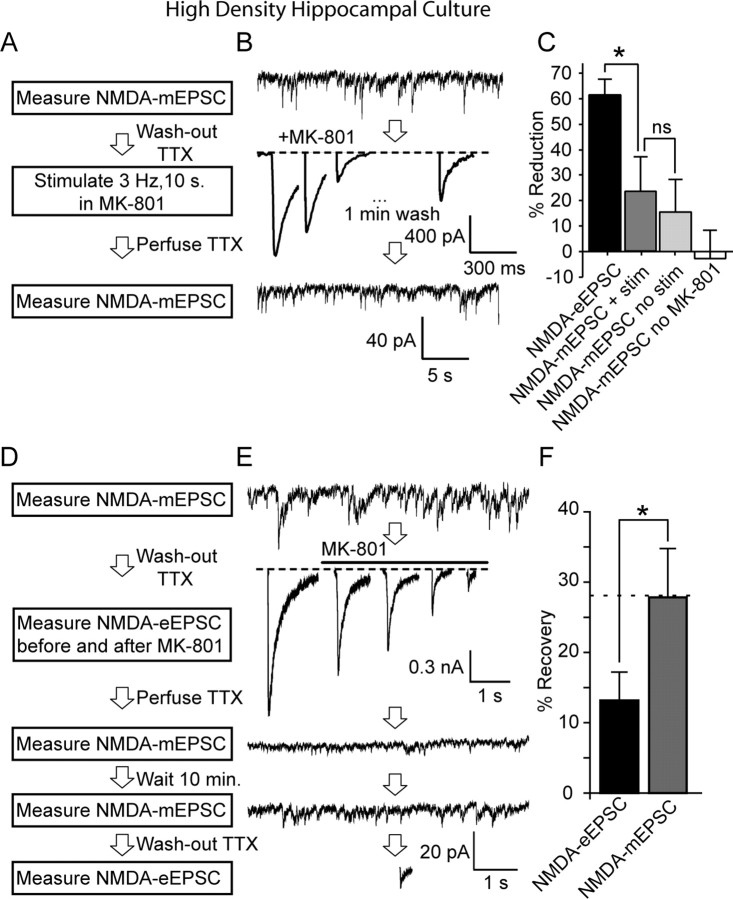
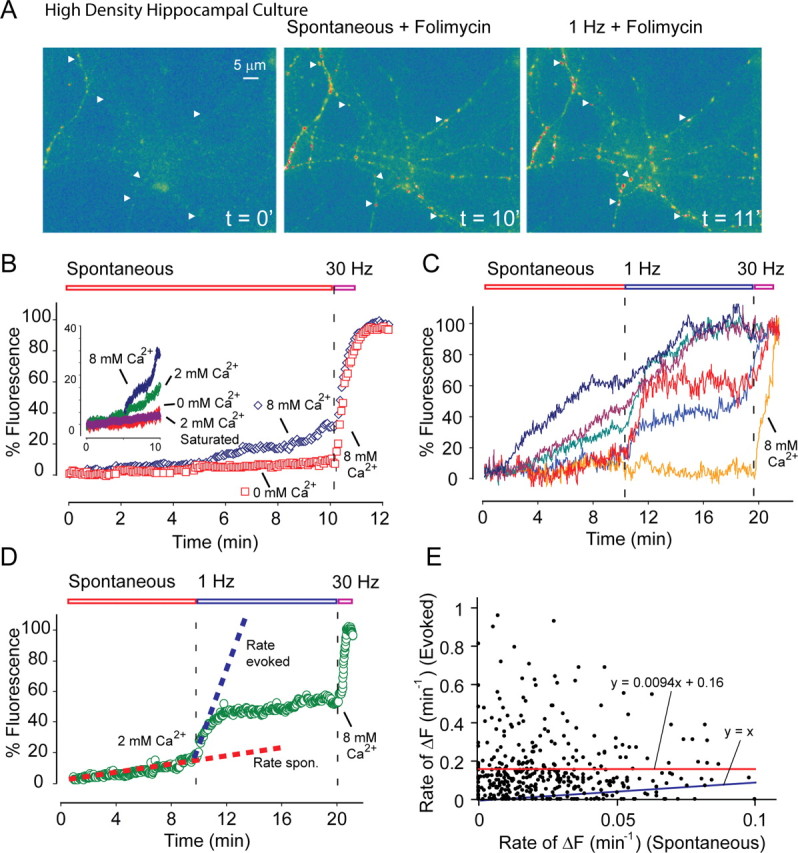
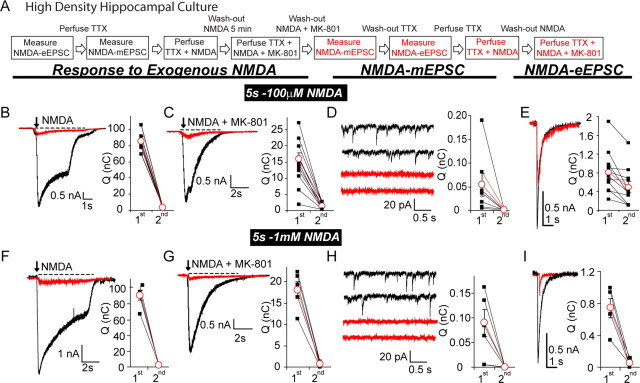
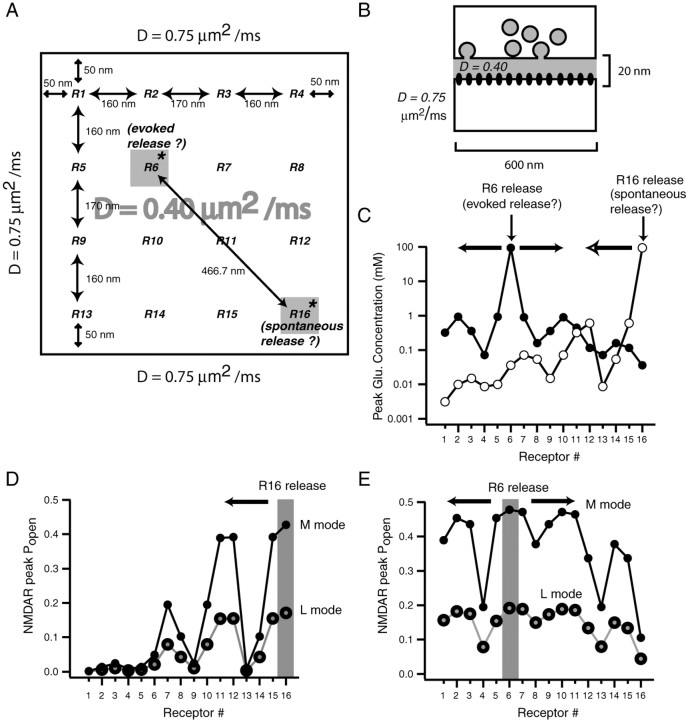
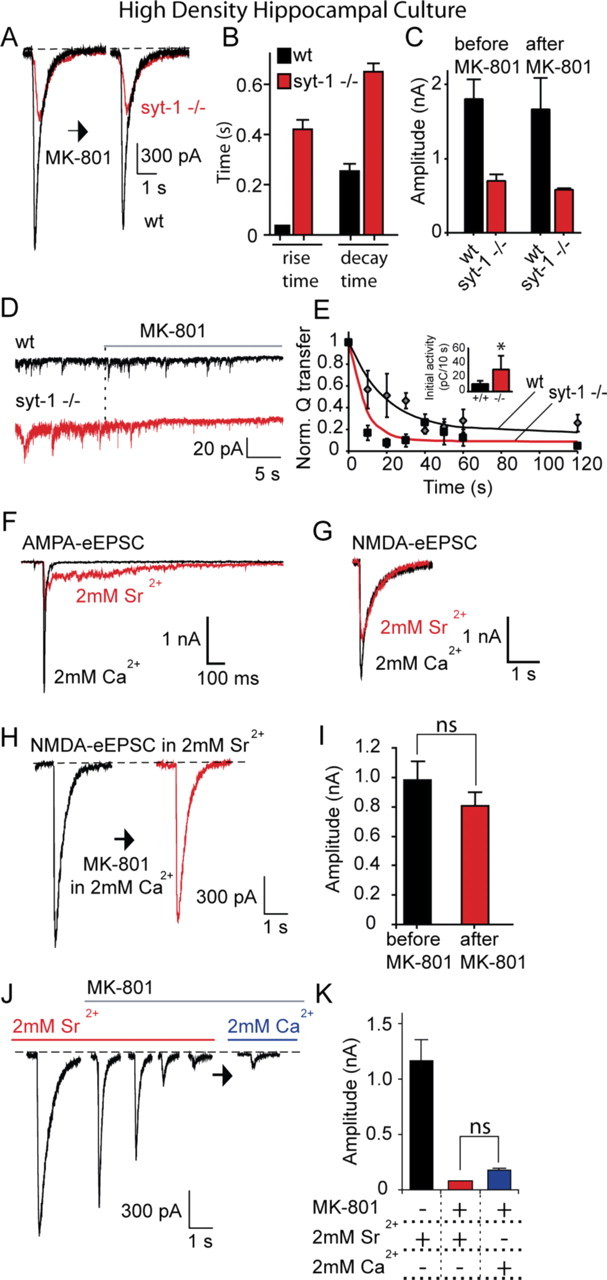
In a synapse, spontaneous and action-potential-driven neurotransmitter release is assumed to activate the same set of postsynaptic receptors. Here, we tested this assumption using (+)-5-methyl-10,11-dihydro-5H-dibenzo [a,d] cyclohepten-5,10-imine maleate (MK-801), a well characterized use-dependent blocker of NMDA receptors. NMDA-receptor-mediated spontaneous miniature EPSCs (NMDA-mEPSCs) were substantially decreased by MK-801 within 2 min in a use-dependent manner. In contrast, MK-801 application at rest for 10 min did not significantly impair the subsequent NMDA-receptor-mediated evoked EPSCs (NMDA-eEPSCs). Brief stimulation in the presence of MK-801 significantly depressed evoked NMDA-eEPSCs but only mildly affected the spontaneous NMDA-mEPSCs detected on the same cell. Optical imaging of synaptic vesicle fusion showed that spontaneous and evoked release could occur at the same synapse albeit without correlation between their kinetics. In addition, modeling glutamate diffusion and NMDA receptor activation revealed that postsynaptic densities larger than approximately 0.2 microm(2) can accommodate two populations of NMDA receptors with nonoverlapping responsiveness. Collectively, these results support the premise that spontaneous and evoked neurotransmissions activate distinct sets of NMDA receptors and signal independently to the postsynaptic side.


Figures

Figure 1.
Figure 1.
MK-801 block of NMDA-mEPSCs in hippocampal cultures. A, NMDA-mEPSCs measured from 20 DIV hippocampal cultures by whole-cell voltage clamp during constant perfusion with extracellular solution containing (in mm) 2 Ca2+, 0 Mg2+, 0.05 picrotoxin, 0.01 CNQX, 0.015 glycine, 0.001 strychnine, and 0.001 TTX. The panel depicts application of 50 μm AP-5 during a representative recording. B, NMDA-mEPSCs recorded in the same setting as in A. The panel depicts application of 10 μm MK-801 during a representative recording. C, D, Traces show gradual MK-801 block of NMDA-mEPSCs in 12 DIV (C) and 20 DIV (D) cultures (n = 10 for each). E, The time constant for MK-801 block was faster in 20 DIV (τ = 9 s) cultures compared with 12 DIV (τ = 24 s) cultures (down to 20%). In these experiments, NMDA-mEPSC activity was quantified by calculating cumulative charge (Q) transfer in 10 s intervals. F, Charge transfer quantified by summation of area below baseline (noise plus events). Before MK-801, 1091 ± 269 pC; after 10 min in MK-801, 337 ± 55 pC; after AP-5, 319 ± 72 pC (p = 0.016 before and after MK-801, p = 0.84 before and after AP-5). G, The effect of elevated extracellular Ca2+ (switch from 2 mm Ca2+ to 8 mm Ca2+) on NMDA-mEPSCs (top) and AMPA mEPSCs (bottom) at 12 DIV cultures. AMPA mEPSCs are recorded in 2 mm Mg2+, 50 μm picrotoxin, 1 μm TTX. H, Fold increase in mEPSC activity as measured by Q transfer. I, The time constant of MK-801 block decreases to 13 s (from 24 s) at 8 mm Ca2+ (n = 9). NMDA-mEPSC traces are superimposed before and after 2 min of MK-801 application. J, K, Averaged traces for selected clearly identifiable spontaneous events are superimposed before and 2 min after MK-801 treatment; note the faster decay kinetics of MK-801-exposed miniature events. L, M, Comparison of rise and decay times of NMDA-mEPSCs before and 2 min after MK-801 treatment. Both rise and decay times are decreased (10–90% rise times: before MK-801, 11.2 ± 0.85 ms, n = 7 experiments; after MK-801 treatment, 8.05 ± 0.2 ms, n = 7 experiments; decay times before MK-801, τ = 43.9 ± 6.5 ms, n = 7 experiments; after MK-801 treatment, τ = 18.8 ± 0.9 ms, n = 7 experiments). *p < 0.05; **p < 0.01.
Figure 2.
Figure 2.
MK-801 treatment at rest minimally affects subsequent evoked NMDA-eEPSCs in hippocampal cultures. A, B, Protocol and sample traces of experiments testing cross talk between evoked NMDA-eEPSCs and NMDA-mEPSCs. In 20 DIV cultures, evoked NMDAR-mediated currents are measured with field stimulation by application of 20 mA pulses at 0.2 Hz in a solution containing 2 mm Ca2+, 0 mm Mg2+, 50 μm picrotoxin, 10 μm CNQX, 15 μm glycine, and 1 μm strychnine. This type of stimulation activates all of the synapses formed on a given neuron (as judged by FM dye imaging). The cells are then perfused with TTX for 1 min and with TTX plus MK-801 for 10 min. At the end of a 10 min period, MK-801 is washed out with TTX-containing solution for 1 min, and then TTX is rapidly (25 ml/min) washed out for 1 min and NMDA-eEPSCs are again measured (0.2 Hz, 10 pulses). Afterward, MK-801 is reapplied and cells are stimulated at 0.2 Hz for 50 pulses until NMDA responses are depressed. At this point, MK-801 is washed out for 2 min, and the test pulse is given to check for any recovery. C, Sample trace for NMDA-mEPSC recorded in between stimulations, in the presence of TTX and MK-801. D, NMDA-eEPSCs do not show significant decrease (p > 0.25) after MK-801 treatment (before MK-801, 1072 ± 157 pA; after MK-801, 879 ± 114 pA). In response to stimulation in the presence of MK-801, they decrease and show no significant recovery after MK-801 washout (after MK-801 plus stimulation, 88 ± 14 pA; recovery after MK-801 washout, 141 ± 33 pA; p > 0.1). E, Graph depicting the gradual reduction in NMDA-eEPSC amplitudes after a 10 min MK-801 treatment (18 ± 10%; n = 5), the decrease under the same conditions without MK-801 (black circle, 15 ± 5%; n = 4), the percentage of reduction in NMDA-eEPSC amplitudes after incubation in MK-801 plus TTX (as well as CNQX and picrotoxin) for 20 min (42.5 ± 8.1%; n = 5) and 40 min (68.4 ± 8.4%; n = 7).
Figure 3.
Figure 3.
Cross talk between NMDA-eEPSCs and NMDA-mEPSCs in hippocampal slices. A, Sample traces of evoked NMDAR-mediated currents recorded from CA1 pyramidal neurons in rat hippocampal slices. In these experiments, evoked NMDAR-mediated currents were recorded, and subsequently, slices were perfused with 50 μm MK-801 in addition to other blockers (CNQX, picrotoxin, strychnine) required to isolate NMDAR-mediated currents. At the end of the 10 min MK-801 perfusion period, evoked NMDAR-mediated currents were recorded without washing out MK-801 (inset illustrates the increase in the rate of NMDA-eEPSC decay in the presence of MK-801; calibration: 30 pA, 400 ms). B, Bar graph showing NMDA-eEPSC amplitudes before and after MK-801 perfusion (before MK-801, 101 ± 16 pA; after MK-801, 86 ± 16 pA; n = 5, p > 0.2). C, Traces depict the decrease in spontaneous NMDA-mEPSCs during MK-801 perfusion in the 10 min period between evoked stimulations. D, Plot shows the kinetics of MK-801 block of spontaneous NMDA-mEPSCs (τfast = 19 s, τslow = 245 s). NMDA-mEPSC activity is quantified as charge transfer at 10 s intervals.
Figure 4.
Figure 4.
Differential MK-801 block and recovery of NMDA-eEPSCs and NMDA-mEPSCs. A, B, Protocol and sample traces from a representative experiment testing cross talk between spontaneous NMDA-mEPSCs and evoked NMDA-eEPSCs. In 20 DIV cultures, NMDA-mEPSCs were measured for 5 min, and then TTX was rapidly washed out for 1 min, followed by MK-801 application. After 3 Hz stimulation for 10 s, MK-801 was washed out for 1 min, and a test pulse was given to check the level of remaining NMDA-eEPSC amplitude. Finally, TTX was reapplied and NMDA-mEPSCs were measured again. C, Bar graphs showing the percentage of reduction in NMDA-eEPSCs (61.6 ± 6%) and in NMDA-mEPSCs (23.4 ± 16.5%) (*p < 0.05, n = 6). The percentage of reduction in NMDA-mEPSCs without stimulation (15.5 ± 6.6%; n = 5) was comparable with the decrease seen after stimulation. NMDA-mEPSCs show some variability in the absence of stimulation or MK-801 (−2.8 ± 10.9%; n = 4). D, E, Experimental protocol and sample traces from the same experiment as in A and B, depicting spontaneous recovery from MK-801 block. Evoked NMDA-eEPSCs were measured after TTX washout at 0.2 Hz stimulation for 10 pulses. MK-801 was then perfused and neurons were stimulated for another 5 min until evoked responses were diminished. TTX and MK-801 were then perfused to check depression of NMDA-mEPSCs. After 2 min, MK-801 was washed out and NMDA-mEPSCs were recorded for another 10 min. After washout of TTX, evoked NMDA-eEPSCs were measured again to check for spontaneous recovery. F, Quantification of percentage of recovery from MK-801 block. NMDA-mEPSC recovery was measured by comparing charge transfer before MK-801 washout to 10 min after MK-801 removal, whereas evoked recovery was assessed by comparing the last three stimuli during MK-801 application with evoked stimulation after final TTX washout. (NMDA-mEPSC, 27.8 ± 6.7%, n = 5; NMDA-eEPSC, 13.1 ± 3.9%, n = 5, p < 0.03).
Figure 5.
Figure 5.
Cross talk between NMDA-eEPSCs and NMDA-mEPSCs in autaptic cultures. A–E, Quantification of the effect of blocking NMDA-mEPSCs with MK-801 on subsequent evoked NMDA-eEPSCs (n = 6). A, B, NMDA-eEPSCs and mEPSCs were recorded before a 20 min incubation in 5 μm MK-801 and 500 nm TTX. At the end of the 20 min period, MK-801 was washed out and NMDA-eEPSCs and mEPSCs were recorded again. C, Twenty minutes in MK-801 was sufficient to eliminate almost all spontaneous NMDA-mEPSCs. D, In contrast, the decrease in evoked NMDA-eEPSC peak amplitudes was not a statistically significant (p > 0.37). E, The percentage of reduction in NMDA-mEPSCs was significantly higher than the decrease in NMDA-eEPSCs (**p < 0.01). The bar shows the mean percentage of reduction calculated by averaging reduction percentages from individual experiments. F–J, Quantification of the effect of MK-801 block of NMDA-eEPSCs on subsequent NMDA-mEPSCs (n = 8). F, G, mEPSCs were recorded for 1 min, just before a 30 stimuli train at 3 Hz in the presence of MK-801. After the train, MK-801 was washed out for 1 min, and then another evoked NMDA-eEPSC was recorded, followed by the recording of NMDA-mEPSCs for another minute. H, Under these conditions, NMDA-mEPSCs were decreased by 24.2 ± 4.4% (*p < 0.05). I, In contrast, the decrease in NMDA-eEPSCs was 50.6 ± 7.2%. J, The percentage of decrease in NMDA-eEPSCs was significantly higher than the reduction in NMDA-mEPSCs (*p < 0.05).
Figure 6.
Figure 6.
Optical analysis of spontaneous and evoked release with synaptophysin-pHluorin at individual synapses. A, Sample images from spontaneous folimycin-dependent alkalinization experiments. Dissociated cultures are infected with synaptophysin-pHluorin lentivirus at 8 DIV and analyzed starting at 13–14 DIV. After baseline imaging for 1 min, 10 nm freshly prepared folimycin was applied to bath. Cultures were allowed to rest for 10 min in the presence of 10 μm CNQX, 50 μm AP-5, and 50 μm PTX to estimate spontaneous fusion rate with image acquisition every 3 s at 100 ms exposure. Arrowheads point to representative boutons selected for analysis. Afterward, cells were stimulated with a 25 mA–1 ms parallel field electrode at 1 Hz frequency for 10 min. At the end of the 10 min period, cultures were exposed to 8 mm Ca2+ and stimulated at 30 Hz for 600 pulses for maximal stimulation to estimate total pool size. Scale bar applies to all three images. B, Spontaneous alkalinization rate in 0 mm Ca2+ (n = 5 experiments, 166 boutons; reach, 11.3% of total pool size at the end of 10 min) was substantially slower than in 8 mm Ca2+ (n = 6 experiments, 198 boutons; reach, 37.1% of total pool size at the end of 10 min) (p < 0.01). Inset, Comparison of spontaneous alkalinization rates in three different Ca2+ concentrations (8 mm, 2 mm, 0 mm) and the same rate 3 min after saturating stimulation (30 Hz, 2 min, n = 3 experiments, 366 boutons) in 2 mm Ca2+. The rate of fluorescence increase after this saturating stimulation was not significantly different from the fluorescence increase at 0 mm Ca2+ (p > 0.5). However, spontaneous alkalinization rates in 8 mm Ca2+ and in 2 mm Ca2+ were significantly different from each other as well as from the rate at 0 mm Ca2+ (p < 0.01). We used the slopes of the linear portions of individual traces to calculate the rate of fluorescence rise from spontaneous and evoked recording segments. C, Sample traces from experiments in which spontaneous alkalinization in the presence of 2 mm Ca2+ was immediately followed by 1 Hz stimulation to estimate evoked release probability. D, Average of normalized traces in 2 mm Ca2+ (n = 9 experiments, 440 boutons; reach, 22.4% of total pool size at the end of 10 min). E, Scatter plot comparing the rate of spontaneous fusion per minute with the rate of fusion evoked at 1 Hz per minute at the level of individual boutons. The plot could be fitted with a trend line with the equation: y = 0.0094x + 0.16, r = 0.001. F, Fluorescence.
Figure 7.
Figure 7.
Relatively higher susceptibility of spontaneous NMDA-mEPSCs to MK-801 block during exogenous NMDA application compared with evoked NMDA-eEPSCs. A, Experimental protocol to test susceptibility of evoked NMDA-eEPSCs and spontaneous NMDA-mEPSCs to exogenously applied NMDA and MK-801. Hippocampal neurons from 15 DIV cultures were whole-cell voltage clamped in an external solution similar to the one in Figure 4. First, a baseline for evoked NMDA currents was obtained by 0.1 Hz stimulation (10 pulses), then TTX was perfused and spontaneous NMDA-mEPSC activity was recorded for 3 min. To obtain an estimate of total NMDA response, 100 μm NMDA containing solution (with 0.5 mm Ca2+ to minimize possible synaptic release that might be caused by opening of presynaptic NMDA channels) was applied exogenously for 5 s and rapidly washed out for 5 min with TTX solution. At the end of the washout, NMDA plus MK-801 (30 μm) was applied for 5 s. Both NMDA and MK-801 were rapidly washed out for 5 min with a TTX containing solution, during which the remaining NMDA-mEPSCs were recorded. Then, TTX was washed out and evoked NMDA-eEPSCs were measured to quantify the extent of block. Finally, solutions containing NMDA alone or with MK-801 were applied again to quantify the extent of reduction in the global NMDA response. B–E, Sample traces and the quantification of NMDA-receptor-mediated responses during and after 5 s 100 μm NMDA plus 30 μm MK-801 application. B, Total NMDA response (5 s; 1st, before NMDA plus MK-801; 2nd, after NMDA plus MK-801) (1st, 85.09 ± 6.25nC; 2nd, 3.6 ± 0.44nC; p < 0.001, n = 5; percentage of decrease, 95.6 ± 0.6%). C, NMDA (100 μm) plus MK-801 application by integration of charge over 5 s. 1st, Initial application (black trace); 2nd, second application (red trace) (1st, 15.89 ± 1.89nC; 2nd, 1.35 ± 0.33nC; p < 0.001, n = 14; percentage of decrease, 90.8 ± 3%). D, NMDA-mEPSCs, quantified by charge integration of 20 s. (1st, 0.054 ± 0.025nC; 2nd, 0.0015 ± 0.0005nC; p < 0.001, n = 6; percentage of decrease, 97.3 ± 0.8%). E, Cumulative charge of evoked NMDA-eEPSCs over 1 s (1st, 0.807 ± 0.13nC; 2nd, 0.49 ± 0.11nC; p < 0.05, n = 14; percentage of decrease, 45 ± 8.5%). The decrease in NMDA-mEPSC was significantly higher than the decrease in NMDA-eEPSC, 97.3% vs 45%; p = 0.002. F–I, Similar to B–E, but this time NMDA concentration was 1 mm. F, Total NMDA response (1st, 90.95 ± 6.4nC; 2nd, 2.35 ± 0.45nC; p < 0.001, n = 5; percentage of decrease, 97.2 ± 0.6%. G, NMDA (1 mm) plus MK-801 (1st, 18.14 ± 1.9nC; 2nd, 0.7 ± 0.27nC; p < 0.001, n = 5; percentage of decrease, 96.3 ± 1%). H, NMDA-mEPSCs (1st, 0.08 ± 0.026nC; 2nd, 0.0002 ± 0.0001nC; p < 0.001, n = 5; percentage of decrease, 99.7 ± 0.21%). I, Evoked NMDA-eEPSC (1st, 0.74 ± 0.11nC; 2nd, 0.055 ± 0.022nC; p < 0.001, n = 5; percentage of decrease, 91 ± 2%). The decrease in NMDA-mEPSC was not significantly different from the decrease in NMDA-eEPSC; p > 0.1. Q, Charge.
Figure 8.
Figure 8.
Modeling glutamate diffusion reveals geometric constraints on independent NMDA receptor signaling in individual postsynaptic densities. A, B, Layout of the model used to estimate the minimum distance between two sets of NMDA receptors within a single PSD that respond to glutamate release with limited cross talk. In this model, we simulated isotropic diffusion of 4000 glutamate molecules released from a point source in a simplified synaptic cleft, with a 20 nm distance between the presynaptic and postsynaptic regions that both cover a 600 × 600 nm area (0.36 μm2). To estimate the degree of NMDA receptor activity at various locations, we equally spaced 16 NMDA receptors (R1 through R16) within the 0.36 μm2 PSD area. Within the synaptic cleft, the diffusion coefficient was 0.4 μm2/ms, whereas outside the cleft, the diffusion coefficient was taken as 0.75 μm2/ms. The latter represents the diffusion coefficient for glutamate in free solution. This 600 × 600 nm area enabled us to assess glutamate diffusion and NMDA receptor activation at several locations with respect to the initial point of release. C, Graph depicts the decrease in peak glutamate concentration after release of a single vesicle on top of R6 (a receptor located near the center of the PSD) versus glutamate release on R16 (a receptor at the periphery of the PSD). The distance between these receptors is 466 nm. D, E, Graphs show the peak open probabilities of NMDA receptors after glutamate release on R6 or R16. Open probabilities are estimated using the NMDA receptor activation scheme proposed by Popescu et al. (2004). This scheme incorporates predominant modes of receptor activity (high open probability H-mode, medium open probability M-mode, and low open probability L-mode). D, The decrease in open probabilities of receptors R16 through R1 (in M-mode or L-mode) after release on R16, the putative site of spontaneous release. E, The open probabilities of all receptors in response to glutamate release onto R6, which according to our model is the putative site of evoked release.
Figure 9.
Figure 9.
Asynchronous release detected in the absence of synaptotagmin 1 or in strontium is resistant to MK-801 application at rest. A, Hippocampal cultures from synaptotagmin-1-deficient mice and wild-type littermates are stimulated to elicit NMDA-eEPSCs as in Figure 2. Between the two stimulations, a solution containing TTX plus MK-801 was perfused for 10 min, and NMDA-mEPSCs were recorded (shown in D). At the end of the 10 min period, MK-801 and TTX were rapidly washed out, and cells were stimulated to evoke an NMDA-eEPSC again. B, Comparison of rise and decay times of evoked NMDA-eEPSC in wild-type and synaptotagmin-1-deficient cultures [rise times: wild type (wt), 35.6 ± 2.9 ms (n = 5); syt-1 −/−, 421.8 ± 35.1 ms (n = 5); p < 0.001; decay times: wt, 255.6 ± 27 ms (n = 5); syt-1 −/−, 649.5 ± 34.7 ms (n = 5); p < 0.05]. C, NMDA-eEPSC amplitudes did not show a significant change in wild-type and synaptotagmin-1-deficient cultures [before MK-801: wt, 1795 ± 261 pA (n = 5); syt-1 −/−, 700 ± 84 pA (n = 5); after MK-801: wt, 1656 ± 420 pA; syt-1 −/−, 583 ± 15 pA (wt, p > 0.7; syt-1 −/−, p > 0.2)]. D, NMDA-mEPSC traces from the same experiments as shown in A. E, The time constant of MK-801 block is significantly faster in synaptotagmin-1-deficient cultures (p < 0.02). For wt, τ = 19 s, and for syt-1 −/−, τ = 8 s. Inset, Baseline charge transfer per 10 s; wt, 10.4 ± 4 pC/10 s; syt-1 −/−, 30.2 ± 18 pC/10 s; *p < 0.05. F, G, Sr2+ dramatically desynchronizes evoked AMPA-eEPSC but not NMDA-eEPSC currents in wild-type cultures. H, I, Wild-type hippocampal cultures are stimulated to elicit NMDA-eEPSCs, as in A, in the presence of 2 mm Sr2+ instead of Ca2+. Between the two stimulations, NMDA-mEPSCs were recorded in Ca2+ as in A and B. NMDA-eEPSC amplitudes did not show a significant change [before MK-801, 978 ± 128 pA (n = 5); after MK-801, 803 ± 54 pA; p > 0.2]. J, K, Wild-type hippocampal neurons are stimulated to elicit NMDA-eEPSC in the presence of 2 mm Sr 2+ at 0.1 Hz until a stable baseline is achieved, MK-801 is then perfused and stimulation is continued for another 3 min until the responses are blocked. Sr2+ is then washed out, and Ca2+ is washed in, and evoked responses are measured again to check for any recovery. The depressed evoked NMDA-eEPSCs did not recover significantly [before MK-801, 1202.5 ± 199.5 pA (n = 5); after 3 min stimulation in MK-801, 78.7 ± 6 pA; after Sr2+ is replaced with Ca2+, 182.5 ± 15 pA; p > 0.1].

References

    1. Chadderton P, Margrie TW, Häusser M. Integration of quanta in cerebellar granule cells during sensory processing. Nature. 2004;428:856–860. - PubMed
    1. Coggan JS, Bartol TM, Esquenazi E, Stiles JR, Lamont S, Martone ME, Berg DK, Ellisman MH, Sejnowski TJ. Evidence for ectopic neurotransmission at a neuronal synapse. Science. 2005;309:446–451. - PMC - PubMed
    1. Colméus C, Gomez S, Molgó J, Thesleff S. Discrepancies between spontaneous and evoked synaptic potentials at normal, regenerating and botulinum toxin poisoned mammalian neuromuscular junctions. Proc R Soc Lond B Biol Sci. 1982;215:63–74. - PubMed
    1. Courant R, Friedrichs K, Lewy H. Über die partiellen differenzengleichungen der mathematischen Physik. Mathematische Annalen. 1928;100:32–74.
    1. Cull-Candy SG, Leszkiewicz DN. Role of distinct NMDA receptor subtypes at central synapses. Sci STKE. 2004;2004 re16. - PubMed

Publication types

MeSH terms

Substances

LinkOut - more resources