. 2008 Dec;148(4):2021-49.
doi: 10.1104/pp.108.124784. Epub 2008 Oct 1.

The transcript and metabolite networks affected by the two clades of Arabidopsis glucosinolate biosynthesis regulators

Affiliations

The transcript and metabolite networks affected by the two clades of Arabidopsis glucosinolate biosynthesis regulators

Sergey Malitsky et al. Plant Physiol. 2008 Dec.

Abstract

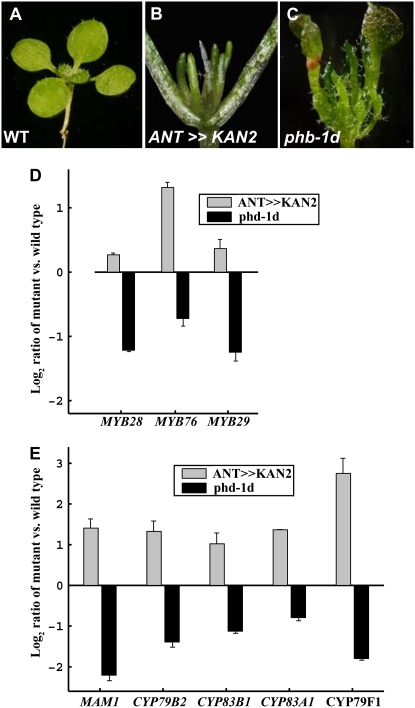
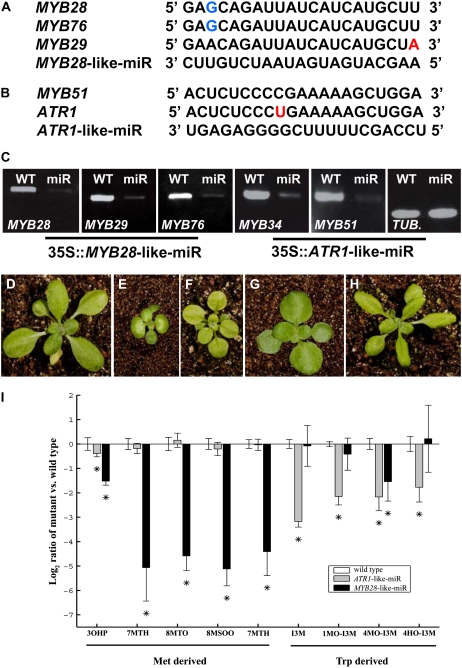
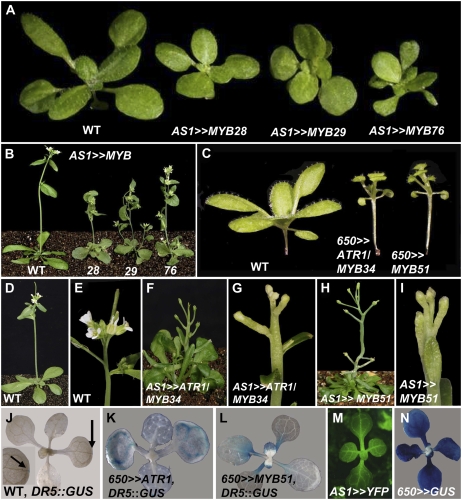
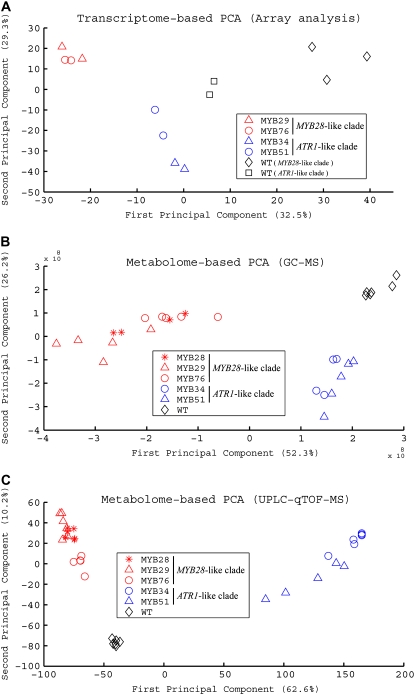
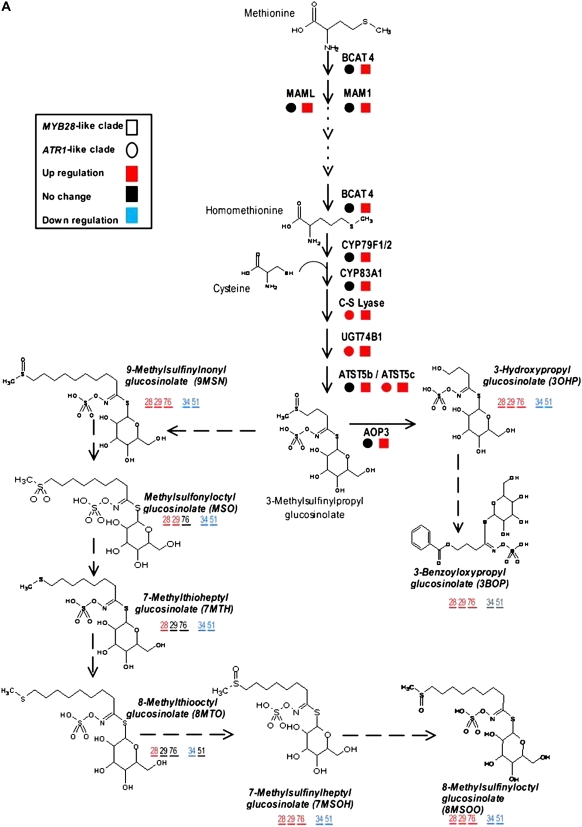
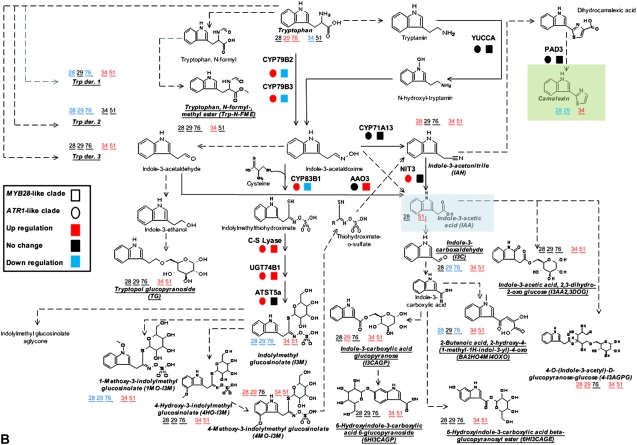
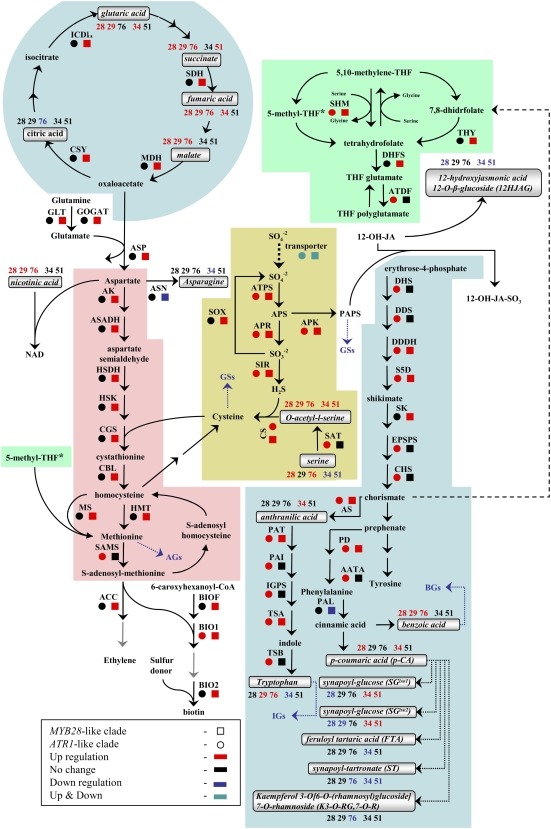
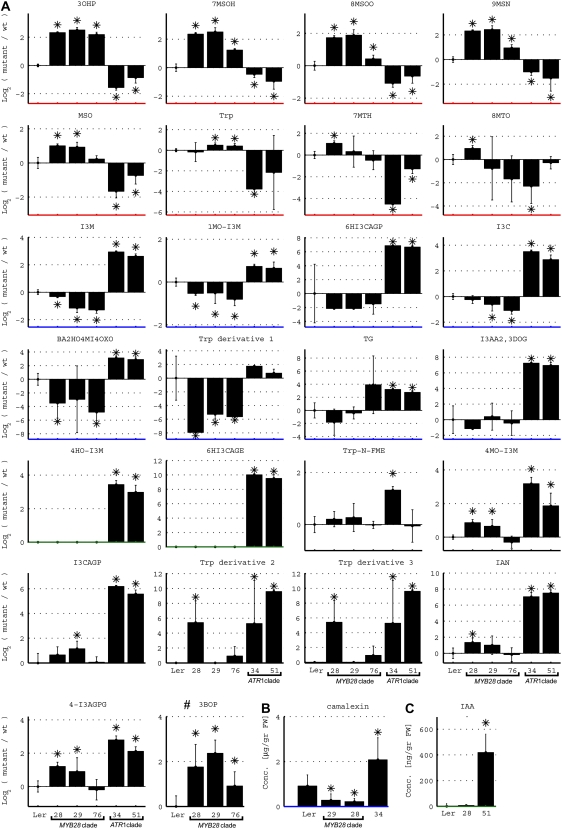
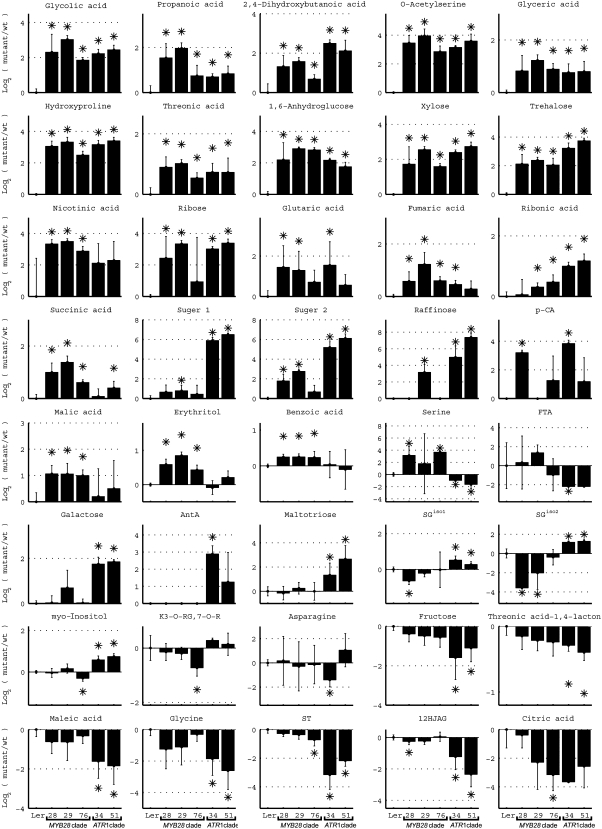
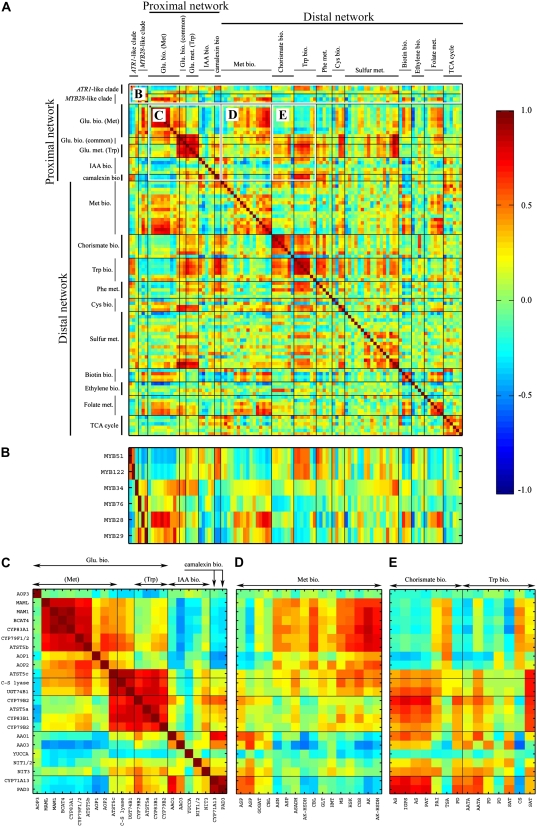
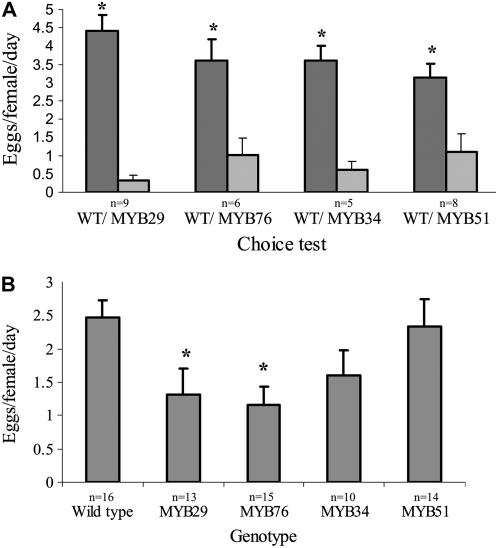
In this study, transcriptomics and metabolomics data were integrated in order to examine the regulation of glucosinolate (GS) biosynthesis in Arabidopsis (Arabidopsis thaliana) and its interface with pathways of primary metabolism. Our genetic material for analyses were transgenic plants overexpressing members of two clades of genes (ALTERED TRYPTOPHAN REGULATION1 [ATR1]-like and MYB28-like) that regulate the aliphatic and indole GS biosynthetic pathways (AGs and IGs, respectively). We show that activity of these regulators is not restricted to the metabolic space surrounding GS biosynthesis but is tightly linked to more distal metabolic networks of primary metabolism. This suggests that with similarity to the regulators we have investigated here, other factors controlling pathways of secondary metabolism might also control core pathways of central metabolism. The relatively broad view of transcripts and metabolites altered in transgenic plants overexpressing the different factors underlined novel links of GS metabolism to additional metabolic pathways, including those of jasmonic acid, folate, benzoic acid, and various phenylpropanoids. It also revealed transcriptional and metabolic hubs in the "distal" network of metabolic pathways supplying precursors to GS biosynthesis and that overexpression of the ATR1-like clade genes has a much broader effect on the metabolism of indolic compounds than described previously. While the reciprocal, negative cross talk between the methionine and tryptophan pathways that generate GSs in Arabidopsis has been suggested previously, we now show that it is not restricted to AGs and IGs but includes additional metabolites, such as the phytoalexin camalexin. Combining the profiling data of transgenic lines with gene expression correlation analysis allowed us to propose a model of how the balance in the metabolic network is maintained by the GS biosynthesis regulators. It appears that ATR1/MYB34 is an important mediator between the gene activities of the two clades. While it is very similar to the ATR1-like clade members in terms of downstream gene targets, its expression is highly correlated with that of the MYB28-like clade members. Finally, we used the unique transgenic plants obtained here to show that AGs are likely more potent deterrents of the whitefly Bemisia tabaci compared with IGs. The influence on insect behavior raises an important question for future investigation of the functional aspect of our initial finding, which pointed to enriched expression of the MYB28-like clade genes in the abaxial domain of the Arabidopsis leaf.


Figures

Figure 1.
Figure 1.
Detection of the MYB-type GS regulators in the abaxial leaf domain. A to C, Genotypes used for array analysis included the wild type (WT; A), a transgenic plant expressing the KAN gene under the control of the ANT promoter (abaxialized; B), and a plant with a dominant mutation in the PHB gene (adaxialized; C). Microarrays were used to identify abaxial-enriched genes differentially expressed between the adaxial and abaxial leaf domains (see “Materials and Methods”). D and E, Differential mRNA expression levels between the two leaf domains for the three MYB transcription factors (D) and for known markers of GS biosynthesis (E). The mRNA levels are presented as log2 ratios versus wild-type levels, and in all cases there was a statistically significant difference (P < 0.05) between the genotypes representing either leaf domain.
Figure 2.
Figure 2.
Reduced expression of multiple members of the two clades of MYB genes by use of synthetic miRs and its effects. A, A sequence region unique to the MYB28-like clade (MYB28, MYB29, and MYB76) permitted the design of a synthetic miR (MYB28-like-miR) that targets all three genes. Blue letters represent a G-U wobble, and the red letter represents a mismatch. B, The ATR1-like-miR, designed to target MYB51 and ATR1 simultaneously. The red letter represents a mismatch. C, Down-regulation of the different MYB gene expression as detected by RT-PCR experiments in the wild type (WT; left in each panel) and transgenic lines (right in each panel) expressing synthetic miRs (plants are shown below). The TUBULIN (TUB) gene was used as a control. D to F, Phenotypes of a wild-type plant (D), a transgenic line expressing the MYB28-like-miR (E), and a transgenic line expressing the ATR1-like-miR (F). Both miRs were expressed under the control of the 35S CaMV promoter. G, A cross between a plant overexpressing MYB28 and a MYB28-like-miR plant could rescue the MYB28-like-miR phenotype. H, A cross between a plant overexpressing ATR1/MYB34 and a ATR1-like-miR plant could rescue the ATR1-like-miR phenotype. I, Met- and Trp-derived GS accumulation in 35S∷MYB28-like-miR- and 35S∷ATR1-like-miR-expressing plants. The samples were collected from 14-d-old rosette leaves and analyzed by UPLC-qTOF-MS (see “Materials and Methods”). Relative IG levels are shown as means ± se from six independent samples; asterisks indicate values that are statistically significantly different (P < 0.05) compared with wild-type values. The metabolite levels shown are presented as log ratios from the wild type (levels of the latter, therefore, are always zero). For gene names, see Figure 7 legend.
Figure 3.
Figure 3.
Phenotypes of plants overexpressing genes of the two clades. A and B, Seedlings (A) and plants (B) overexpressing the MYB28-like clade genes under the control of the early AS1 promoter. C, Overexpression of ATR1-like clade members under the control of the relatively late 650 promoter. D and E, Wild-type (WT) plant (D) and wild-type inflorescence (E). F and G, Plant overexpressing ATR1/MYB34 driven by the AS1 promoter (F) and its inflorescence (G). H and I, Plant overexpressing MYB51 driven by the AS1 promoter (H) and its inflorescence (I). J to L, Expression of a DR5:GUS marker for free auxin production in the wild type (J) and in 650≫ATR1 (K) and 650≫MYB51 (L) backgrounds. M and N, Expression pattern of YFP and GUS reporter genes driven by the AS1 promoter (M) and driven by the 650 promoter (N).
Figure 4.
Figure 4.
Metabolite and expression profiles of plants overexpressing members of the two GS regulators differ between them and from those of wild-type plants. PCA of data sets obtained using three different technologies: mRNA GeneChip array (A), GC-MS (B), and UPLC-qTOF-MS (C). In all sections, red symbols mark plants overexpressing the MYB28-like clade genes, blue symbols mark plants overexpressing the ATR1-like clade genes, and black symbols mark wild-type (WT) plants.
Figure 5.
Figure 5.
Gene expression and metabolite levels in the proximal network of Met- and Trp-derived GS pathways. The biosynthesis pathway of Met-derived GSs starting from Met (A) and the biosynthesis pathway of Trp-derived GSs starting from Trp and including branches such as IAA and camalexin biosynthesis (B). The mRNA expression analysis was done with joined values obtained in overexpression plants of each clade, while metabolomic analysis was done separately for each line (see “Materials and Methods”). All metabolites were measured under normal growth conditions except for camalexin (in green), which was detected after AgNO3 treatment (see “Materials and Methods”). All known enzymatic reactions are marked with black arrows, while the predicted reactions are marked with dotted arrows. Colored squares and circles represent statistically significant changes in gene expression of the overexpression plants belonging to the MYB28-like and ATR1-like clade genes, respectively. Putatively identified compounds are marked with boldface and italic characters, and the colored numbers represent statistically significant changes in the corresponding overexpression lines. Underlined metabolites were positioned in the pathway based on results obtained by isotope feeding experiments and predictions (see explanation of the DLEMMA approach in Supplemental Data Set S1). Detailed information regarding each gene can be found in Supplemental Table S4. See also Figure 7 for metabolite profiles of the proximal network metabolites.
Figure 5.
Figure 5.
Gene expression and metabolite levels in the proximal network of Met- and Trp-derived GS pathways. The biosynthesis pathway of Met-derived GSs starting from Met (A) and the biosynthesis pathway of Trp-derived GSs starting from Trp and including branches such as IAA and camalexin biosynthesis (B). The mRNA expression analysis was done with joined values obtained in overexpression plants of each clade, while metabolomic analysis was done separately for each line (see “Materials and Methods”). All metabolites were measured under normal growth conditions except for camalexin (in green), which was detected after AgNO3 treatment (see “Materials and Methods”). All known enzymatic reactions are marked with black arrows, while the predicted reactions are marked with dotted arrows. Colored squares and circles represent statistically significant changes in gene expression of the overexpression plants belonging to the MYB28-like and ATR1-like clade genes, respectively. Putatively identified compounds are marked with boldface and italic characters, and the colored numbers represent statistically significant changes in the corresponding overexpression lines. Underlined metabolites were positioned in the pathway based on results obtained by isotope feeding experiments and predictions (see explanation of the DLEMMA approach in Supplemental Data Set S1). Detailed information regarding each gene can be found in Supplemental Table S4. See also Figure 7 for metabolite profiles of the proximal network metabolites.
Figure 6.
Figure 6.
Gene expression and metabolite levels in the distal network pathways related to Met- and Trp-derived GS biosynthesis. Each metabolic pathway is indicated by a different color: Trp and Phe biosynthesis and metabolism in blue, Met biosynthesis and metabolism in pink, TCA cycle in blue, sulfur assimilation and metabolism in yellow, and folate metabolism in green. The mRNA expression analysis was done with joined values obtained in overexpression plants of each clade, while metabolite analysis was done separately for each line (see “Materials and Methods”). All known enzymatic reactions are marked with black arrows, while the predicted or multiple reactions are marked with dotted arrows. Colored squares and circles represent statistically significant changes in gene expression of plants overexpressing the MYB28-like and ATR1-like clade genes, respectively. Putatively identified compounds are marked with squares, and the colored numbers represent statistically significant changes in the corresponding overexpression lines. Detailed information regarding each gene can be found in Supplemental Table S4, and metabolite profiles of the distal network metabolites can be found in Figure 8 (and partially in Supplemental Fig. S2).
Figure 7.
Figure 7.
Accumulation of proximal network metabolites related to Met- and Trp-derived GS pathways. A, Levels in wild-type (wt) plants (Ler) and plants overexpressing the MYB28-like clade (MYB28, MYB29, and MYB76) and the ATR1-like clade (ATR1/MYB34 and MYB51) genes. The metabolite levels in these charts are presented as log ratios from the wild type (levels of the latter, therefore, are always zero). B and C, Camalexin concentrations in wild-type and MYB29-, MYB28-, and ATR1/MYB34-overexpressing plants (leaf tissue) after treatment with AgNO3 (B) and levels of IAA in wild-type plants and plants overexpressing MYB28 and MYB51 (leaf tissue; C). Metabolite levels are shown as means ± se from six (UPLC-qTOF-MS analysis) or five (GC-MS analysis) independent samples; asterisks indicate values that are significantly different (P < 0.05) in comparison with the wild type. The different metabolites are ordered according to the different behaviors, indicated with different colors of the x axes, as follows: red, increase in the MYB28-like clade and decrease in the ATR1-like clade; blue, decrease in the MYB28-like clade and increase in the ATR1-like clade; green, increase in the ATR1-like clade; black, increase in both the MYB28-like clade and the ATR1-like clade. The full names of the detected compounds in this analysis are as follows: Trp indole-3-carboxylate glucopyranose (I3CAGP), 9-methylsulfinylnonyl glucosinolate (9MSN), methylsulfonyloctyl glucosinolate (MSO), 6-hydroxyindole-3-carboxylic acid 6-O-β-glucopyranoside (6HI3CAGP), 6-hydroxyindole-3-carboxylic acid β-glucopyranosyl ester (6HI3CAGE), 3-benzoyloxypropyl glucosinolate (3BOP), Trp N-formyl methyl ester (Trp-N-FME), 1H-indole-3-carboxaldehyde (I3C), 2-butenoic acid, 2-hydroxy-4-(1-methyl-1H-indole-3-yl)-4-oxo (BA2HO4MI4OXO), tryptopol glucopyranoside (TG), 1H-indole-3-acetic acid, 2,3-dihydro-2-oxo Glc (I3AA2,3DOG), 4-O-(indole-3-acetyl)-glucopyranose Glc (4-I3AGPG), 3-hydroxypropyl glucosinolates (3OHP), 7-methylsulfinylheptyl glucosinolates (7MSOH), 8-methylthiooctyl glucosinolates (8MTO), 8-methylsulfinyloctyl glucosinolates (8MSOO), 7-methylthioheptyl glucosinolates (7MTH), 1-methoxyindole glucosinolates (1MO-I3M), indole-3-yl-methyl glucosinolates (I3M), 4-methoxyindole glucosinolates (4MO-I3M), and 4-hydroxyindole-3-yl-methyl glucosinolates (4HO-I3M).
Figure 8.
Figure 8.
Accumulation of representative distal network metabolites related to Met- and Trp-derived GS pathways. Levels in wild-type plants (Ler) and plants overexpressing the MYB28-like clade (MYB28, MYB29, and MYB76) and the ATR1-like clade (ATR1/MYB34 and MYB51) genes. Metabolite levels are shown as means ± se from six (UPLC-qTOF-MS analysis) or five (GC-MS analysis) independent samples; asterisks indicate values that are significantly different (P < 0.05) in comparison with the wild type. The metabolite levels in these charts are presented as log ratios from the wild type (levels of the latter, therefore, are always zero). The full names of the detected compounds in this analysis are as follows: anthranilic acid (AntA), p-coumaric acid (p-CA), synapoyl-Glc (SG; isomers [iso] 1 and 2), 12-hydroxyjasmonic acid 12-O glucoside (12HJAG), feruloyl tartaric acid (FTA), kaempferol 3-O[6-O-(rhamnosyl)glucoside] 7-O-rhamnoside (K3-O-RG,7-O-R).
Figure 9.
Figure 9.
Correlation in expression of members of the two clades and the proximal and distal network genes in response to various biological perturbations. The correlation matrix is for six members of the two clades, all of the proximal and distal network genes that exhibited a statistically significant expression change in one of the overexpression plants. The correlation matrix was calculated using hundreds of publicly available GeneChip experiments (see “Materials and Methods”) representing 211 different biological perturbations. Interesting correlation regions from the complete correlation matrix (A) are indicated in B to E.
Figure 10.
Figure 10.
Oviposition of B. tabaci females (Biotype Q) on five Arabidopsis genotypes: wild type, plants overexpressing MYB29 and MYB76 (both with expression driven by the AS1 promoter), and plants overexpressing ATR1/MYB34 and MYB51 (both with expression driven by the 650 promoter). A, Choice experiments. Vertical bars represent means and se. Asterisks denote significant differences compared with the wild type (paired Student's t test; P < 0.05). Dark and light gray bars represent wild-type plants (WT) and MYB-overexpressing plants, respectively. B, No-choice experiments. Asterisks denote significant differences compared with the wild type (Dunnett's test; P < 0.05). n, Number of biological replicates.

Similar articles

Cited by

References

    1. Aloni R, Schwalm K, Langhans M, Ullrich CI (2003) Gradual shifts in sites of free-auxin production during leaf-primordium development and their role in vascular differentiation and leaf morphogenesis in Arabidopsis. Planta 216 841–853 - PubMed
    1. Alonso JM, Stepanova AN, Leisse TJ, Kim CJ, Chen H, Shinn P, Stevenson DK, Zimmerman J, Barajas P, Cheuk R, et al (2003) Genome-wide insertional mutagenesis of Arabidopsis thaliana. Science 301 653–657 - PubMed
    1. Alvarez JP, Pekker I, Goldshmidt A, Blum E, Amsellem Z, Eshed Y (2006) Endogenous and synthetic microRNAs stimulate simultaneous, efficient, and localized regulation of multiple targets in diverse species. Plant Cell 18 1134–1151 - PMC - PubMed
    1. Bender J, Fink GR (1998) A Myb homologue, ATR1, activates tryptophan gene expression in Arabidopsis. Proc Natl Acad Sci USA 95 5655–5660 - PMC - PubMed
    1. Benjamini Y, Hochberg Y (1995) Controlling the false discovery rate: a practical and powerful approach to multiple testing. J R Stat Soc Ser B Stat Methodol 7 289–300

Publication types

MeSH terms

Associated data